2020 El Paso NOx EmissionsThis chart represents calendar year 2020 nitrogen oxide emissions for El Paso County. 66 percent of emissions are from mobile sources, 22 percent of emissions are from point sources, and 12 percent of emissions are from area sources.https://www.tceq.texas.gov/downloads/air-quality/air-emissions/2020-el-paso-nox-emissions.jpg/viewhttps://www.tceq.texas.gov/downloads/air-quality/air-emissions/2020-el-paso-nox-emissions.jpg/@@images/image-1200-793ea4e73426cc95ead0231d52488b3f.jpeg?v=image
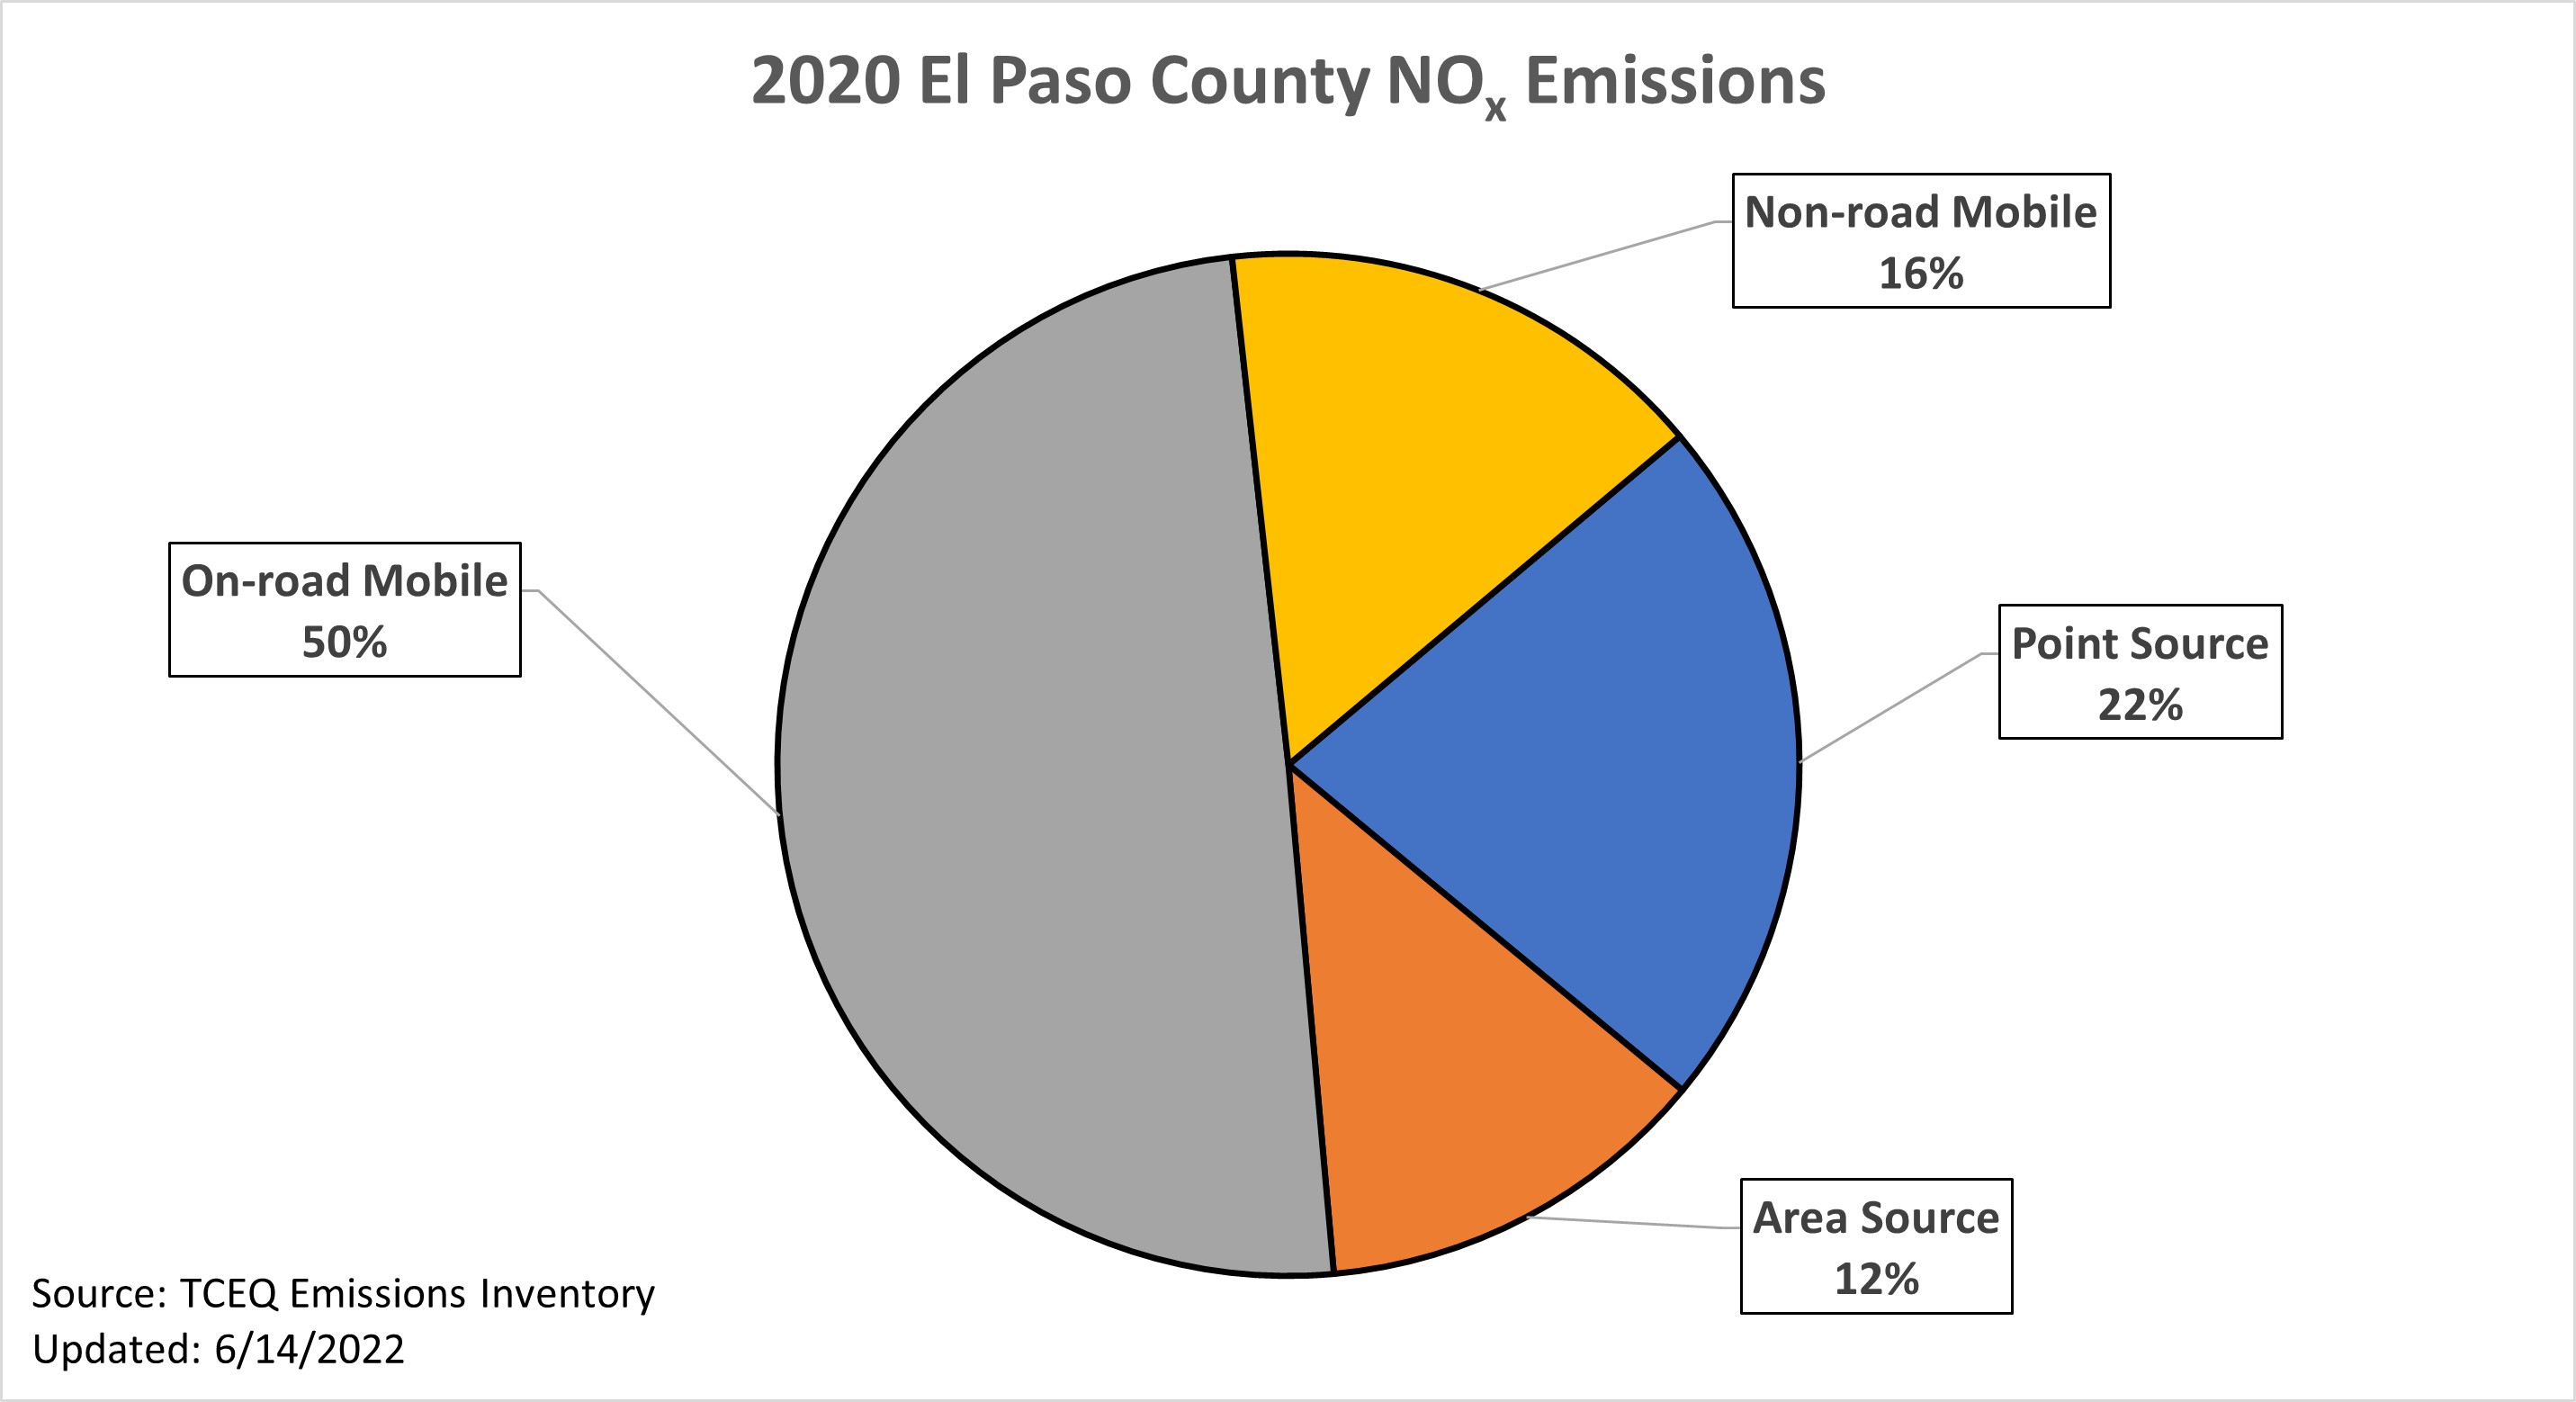
2020 El Paso NOx Emissions
This chart represents calendar year 2020 nitrogen oxide emissions for El Paso County. 66 percent of emissions are from mobile sources, 22 percent of emissions are from point sources, and 12 percent of emissions are from area sources.
