2020 Houston-Galveston Brazoria Area NOx EmissionsThis chart represents calendar year 2020 nitrogen oxide emissions for the eight-county Houston-Galveston-Brazoria area. The HGB area includes Brazoria, Chambers, Fort Bend, Galveston, Harris, Liberty, Montgomery, and Waller counties. 57 percent of emissions are from mobile sources, 30 percent of emissions are from point sources, and 13 percent of emissions are from area sources.https://www.tceq.texas.gov/downloads/air-quality/air-emissions/2020-houston-galveston-brazoria-nox-emissions.jpg/viewhttps://www.tceq.texas.gov/downloads/air-quality/air-emissions/2020-houston-galveston-brazoria-nox-emissions.jpg/@@images/image-1200-cd615d0d950a3be50d6568a466d601c5.jpeg?v=image
2020 Houston-Galveston Brazoria Area NOx Emissions
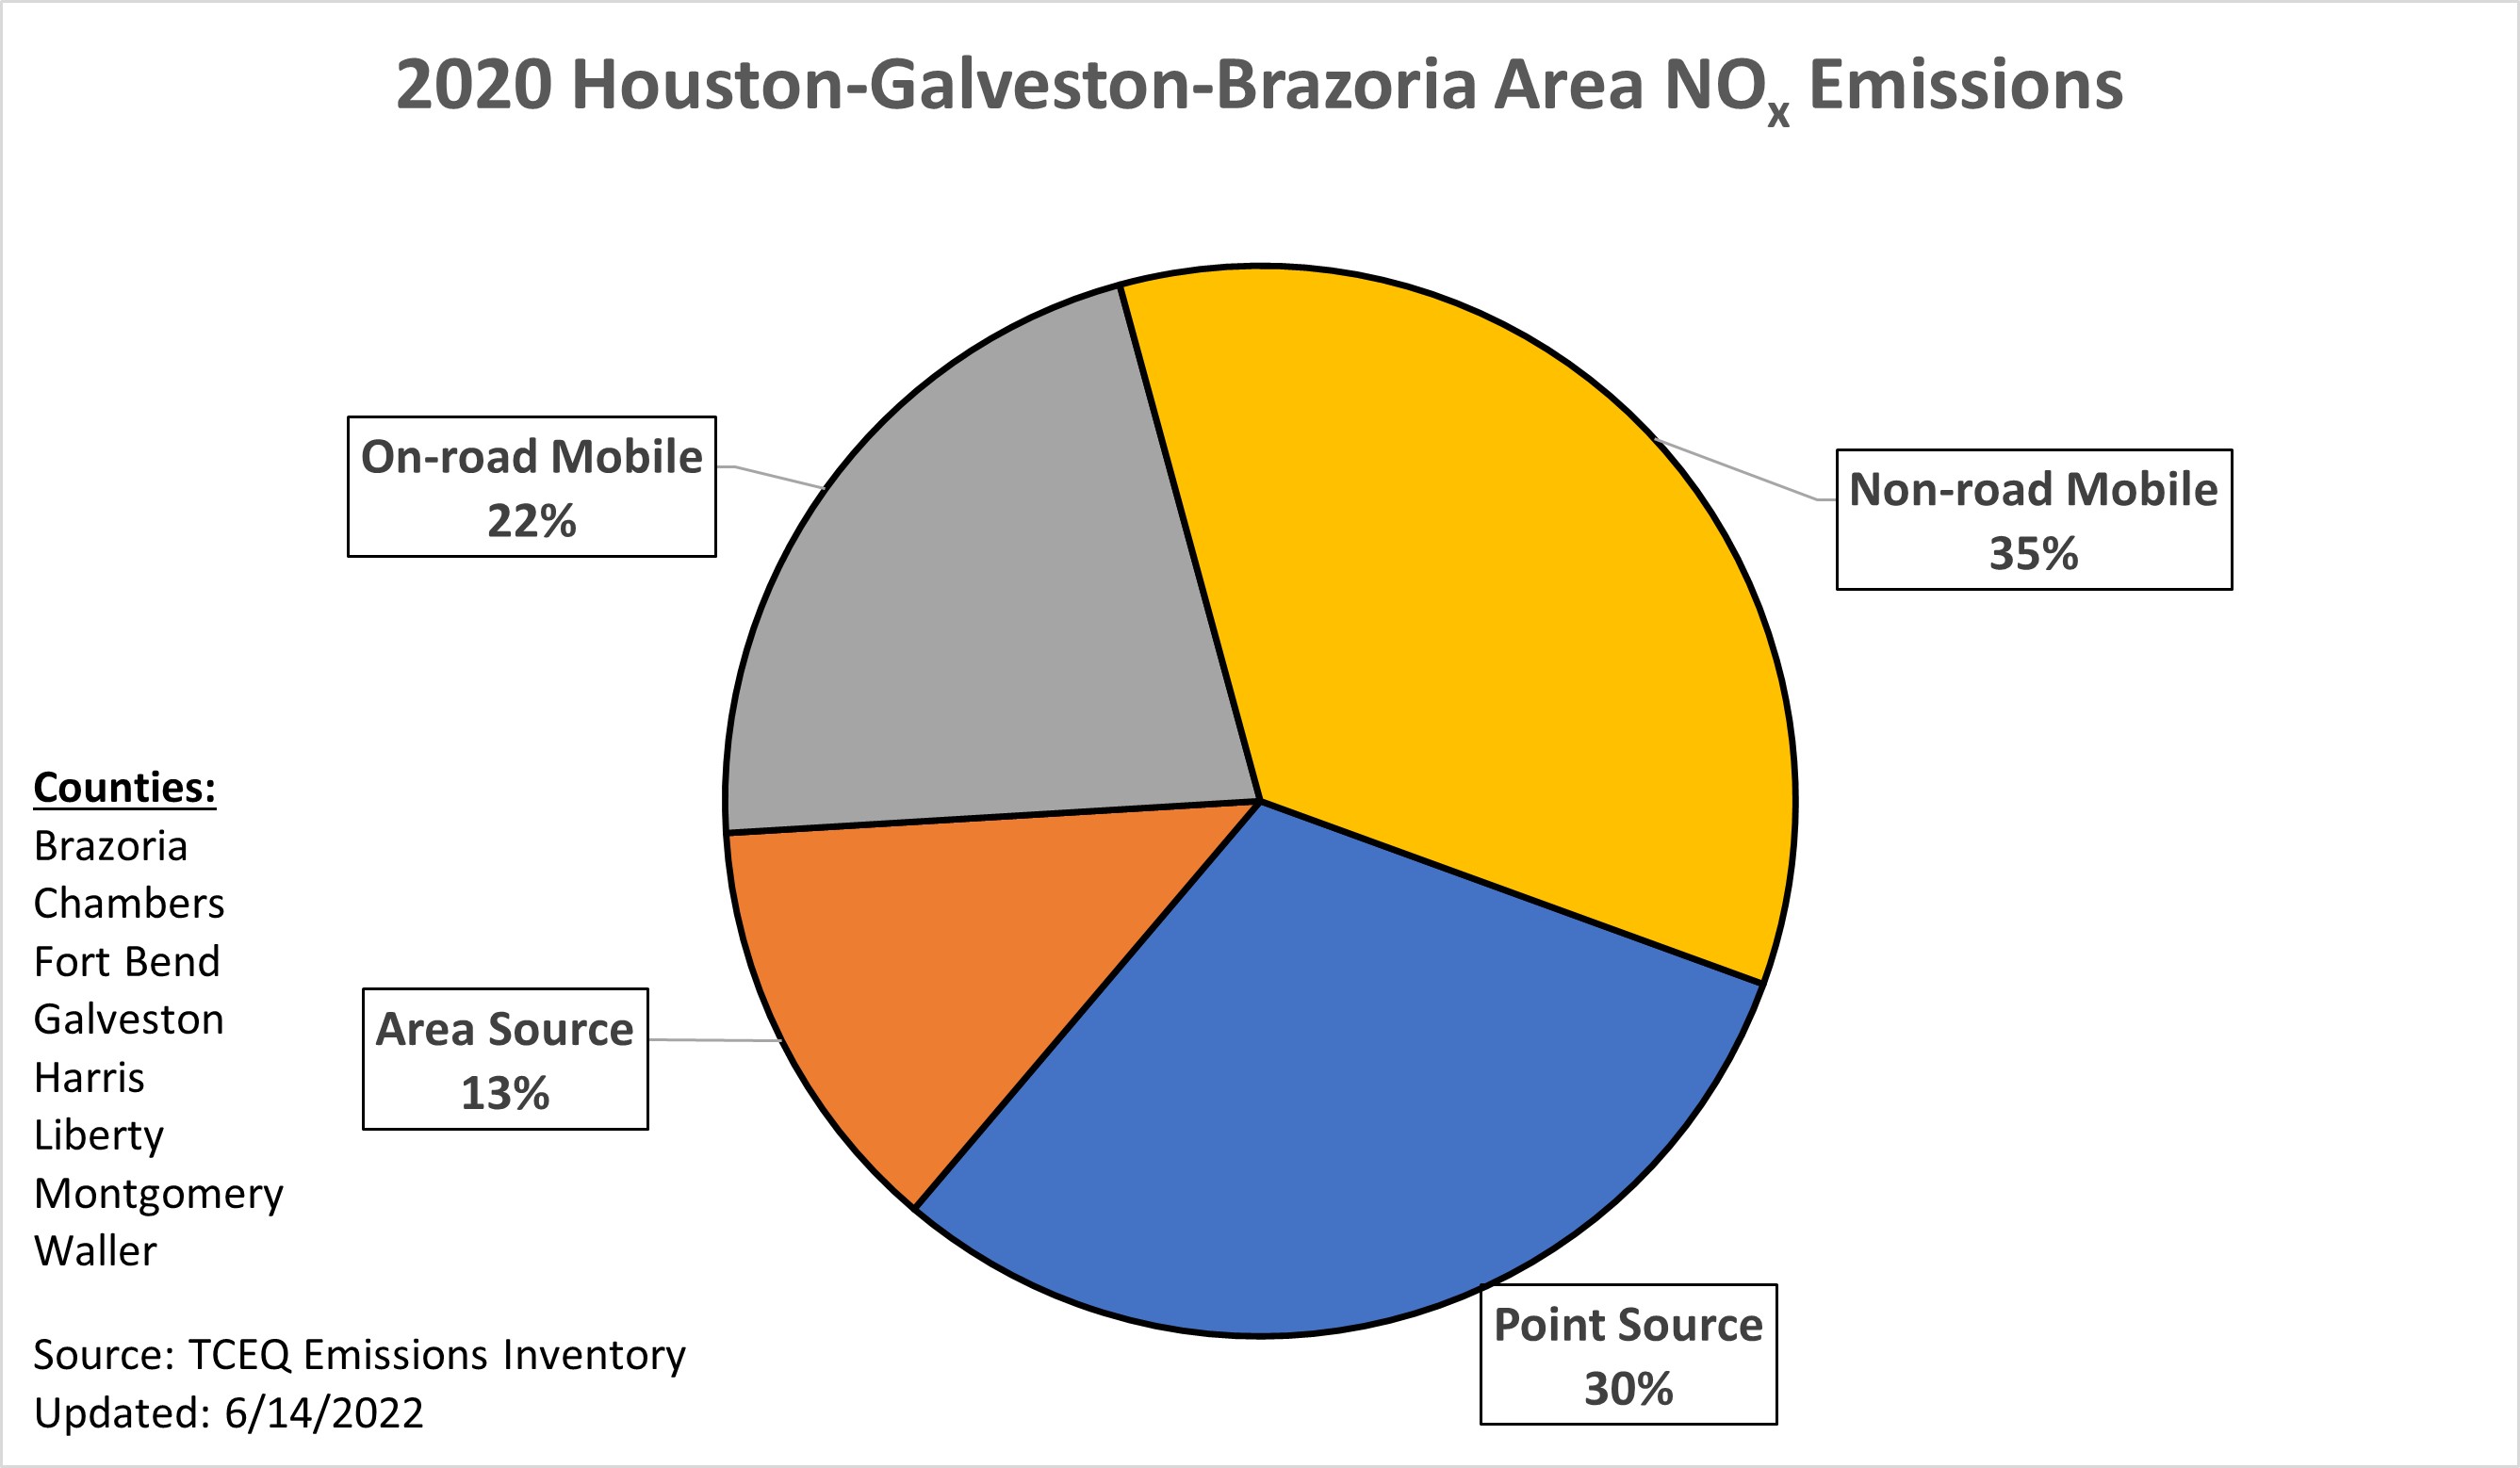
This chart represents calendar year 2020 nitrogen oxide emissions for the eight-county Houston-Galveston-Brazoria area. The HGB area includes Brazoria, Chambers, Fort Bend, Galveston, Harris, Liberty, Montgomery, and Waller counties. 57 percent of emissions are from mobile sources, 30 percent of emissions are from point sources, and 13 percent of emissions are from area sources.
