2020 Texas VOC EmissionsThis chart represents calendar year 2020 volatile organic compound emissions for the State of Texas. 88 percent of emissions are from area sources, 7 percent of emissions are from mobile sources, and 5 percent of emissions are from point sources.https://www.tceq.texas.gov/downloads/air-quality/air-emissions/2020-texas-voc-emissions.jpg/viewhttps://www.tceq.texas.gov/downloads/air-quality/air-emissions/2020-texas-voc-emissions.jpg/@@images/image-1200-2157d6e22cd94724b4541bb14c0c7998.jpeg?v=image
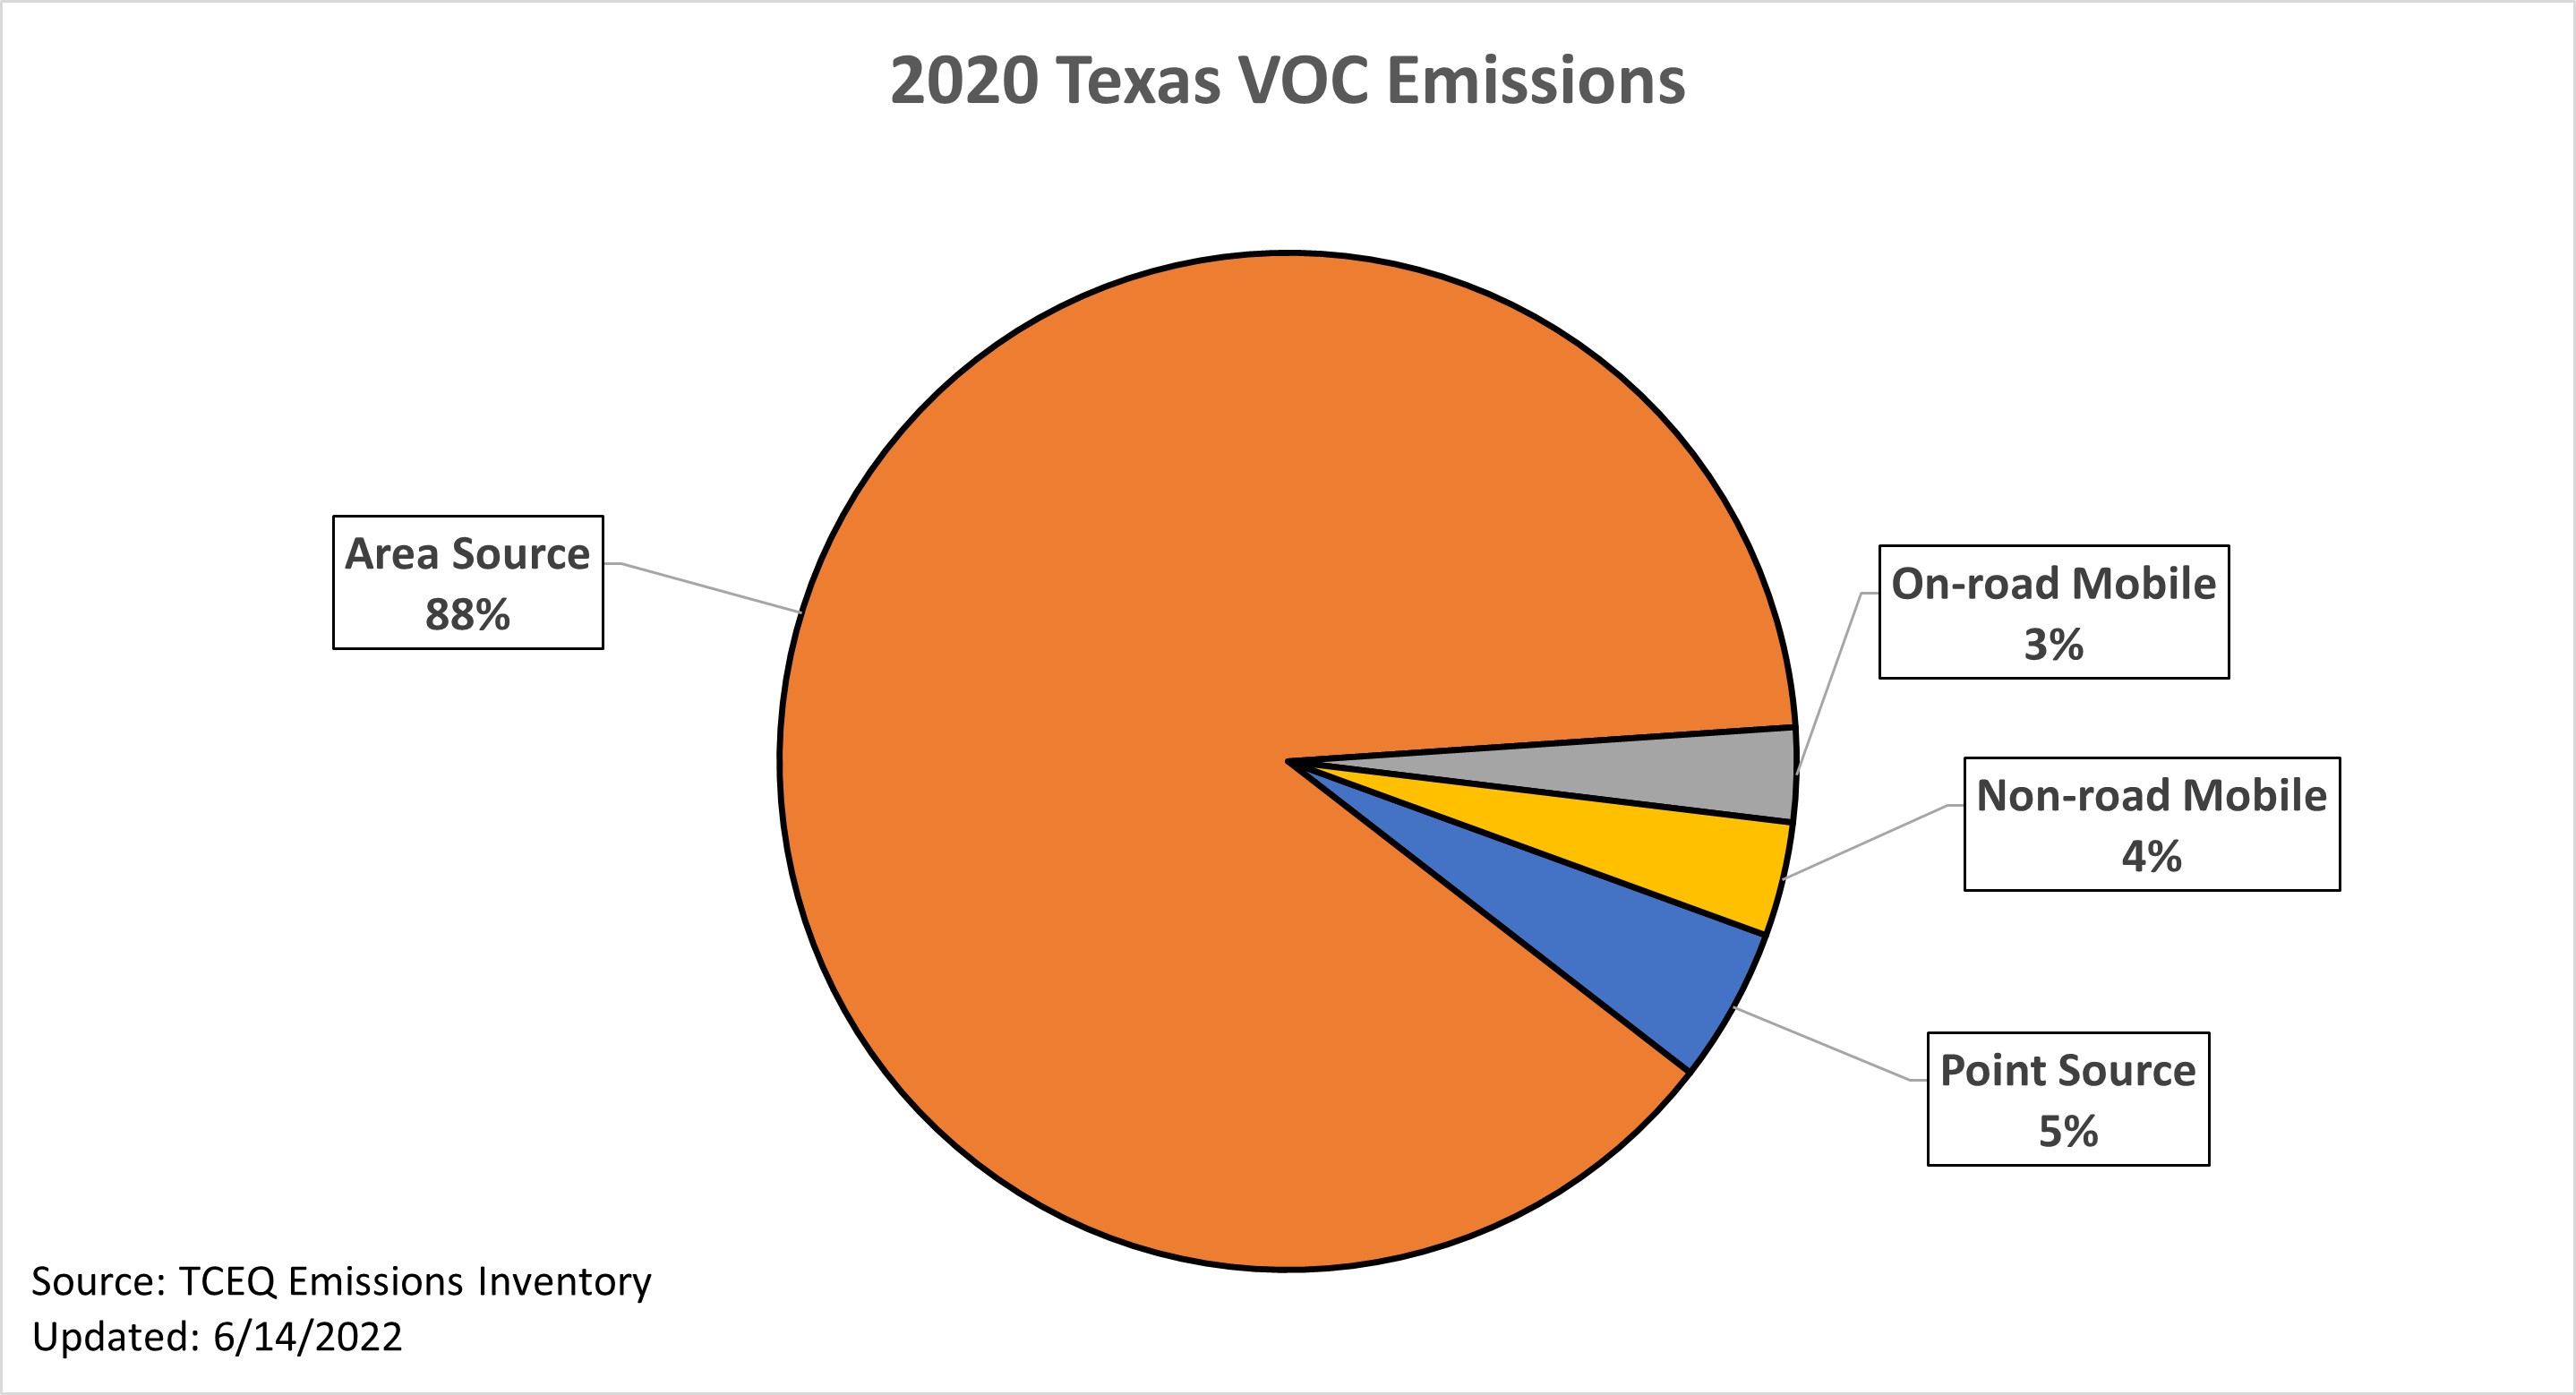
2020 Texas VOC Emissions
This chart represents calendar year 2020 volatile organic compound emissions for the State of Texas. 88 percent of emissions are from area sources, 7 percent of emissions are from mobile sources, and 5 percent of emissions are from point sources.
