tab2-chart01-2021.jpgEight-hour ozone design value trend chart vs population for the Austin-Round Rock area.https://www.tceq.texas.gov/downloads/air-quality/success/images/tab2-chart01-2021.jpg/viewhttps://www.tceq.texas.gov/downloads/air-quality/success/images/tab2-chart01-2021.jpg/@@images/image-1200-e3387a6189ac41a4ffa03369b49b1f04.jpeg?v=image
tab2-chart01-2021.jpg
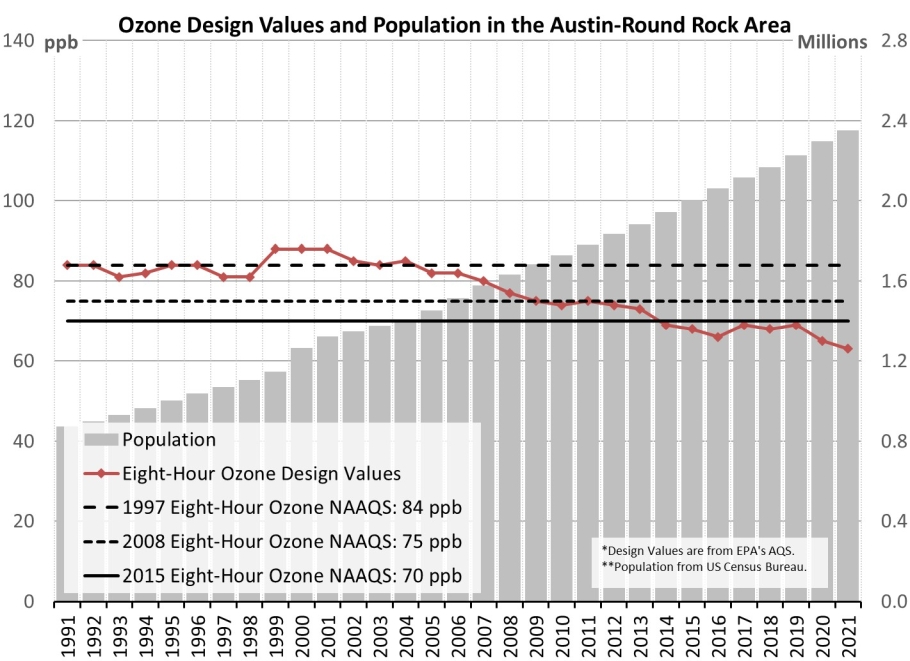
Eight-hour ozone design value trend chart vs population for the Austin-Round Rock area.
