tab2-chart02-2021.jpgEight-hour ozone design value trend chart vs population for the Beaumont-Port Arthur area.https://www.tceq.texas.gov/downloads/air-quality/success/images/tab2-chart02-2021.jpg/viewhttps://www.tceq.texas.gov/downloads/air-quality/success/images/tab2-chart02-2021.jpg/@@images/image-1200-09ae2c66dbe831d468ca72724aa142ce.jpeg?v=image
tab2-chart02-2021.jpg
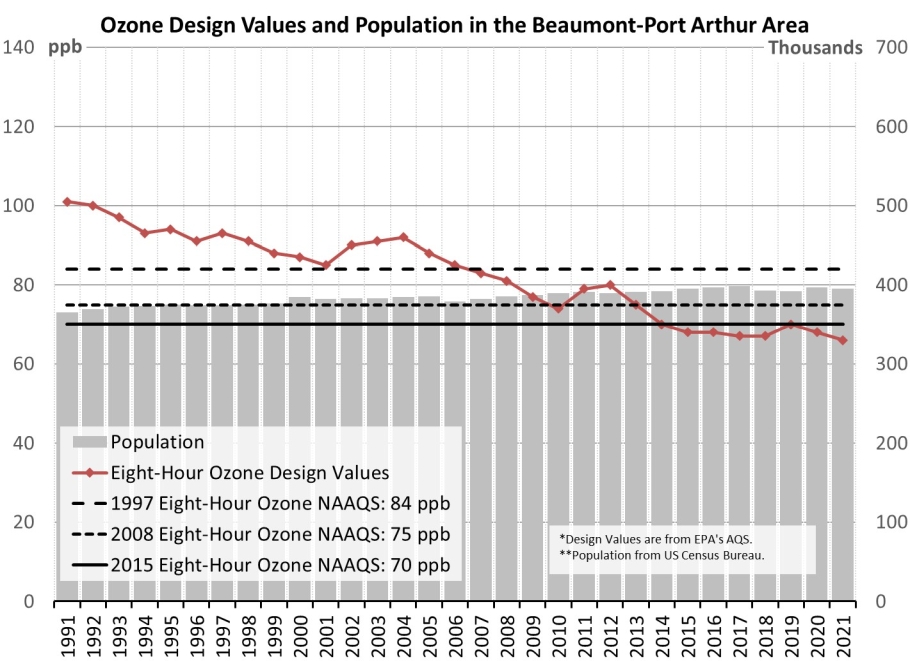
Eight-hour ozone design value trend chart vs population for the Beaumont-Port Arthur area.
