tab2-chart06-2021.jpgEight-hour ozone design value trend chart vs population for the San Antonio area.https://www.tceq.texas.gov/downloads/air-quality/success/images/tab2-chart06-2021.jpg/viewhttps://www.tceq.texas.gov/downloads/air-quality/success/images/tab2-chart06-2021.jpg/@@images/image-1200-c87cfe3ff834b71e4fbf44d5b7779896.jpeg?v=image
tab2-chart06-2021.jpg
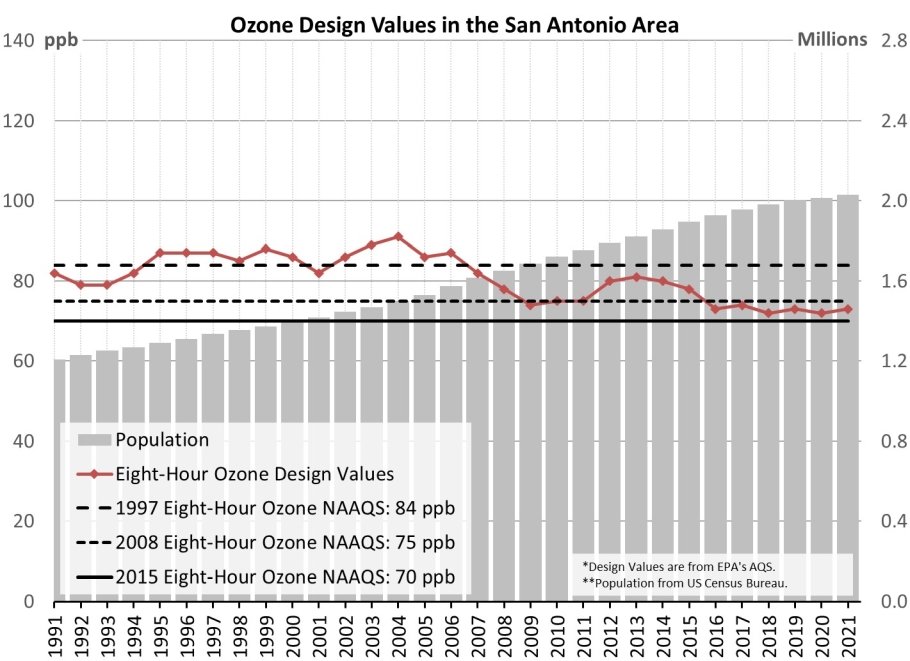
Eight-hour ozone design value trend chart vs population for the San Antonio area.
