tab3-chart02-20221223.jpgImage of VOC emissions in Texas compared to ozone concentrations.https://www.tceq.texas.gov/downloads/air-quality/success/images/tab3-chart02-20221223.jpg/viewhttps://www.tceq.texas.gov/downloads/air-quality/success/images/tab3-chart02-20221223.jpg/@@images/image-1200-94da0471f382aa1809f3563845ea1865.jpeg?v=image
tab3-chart02-20221223.jpg
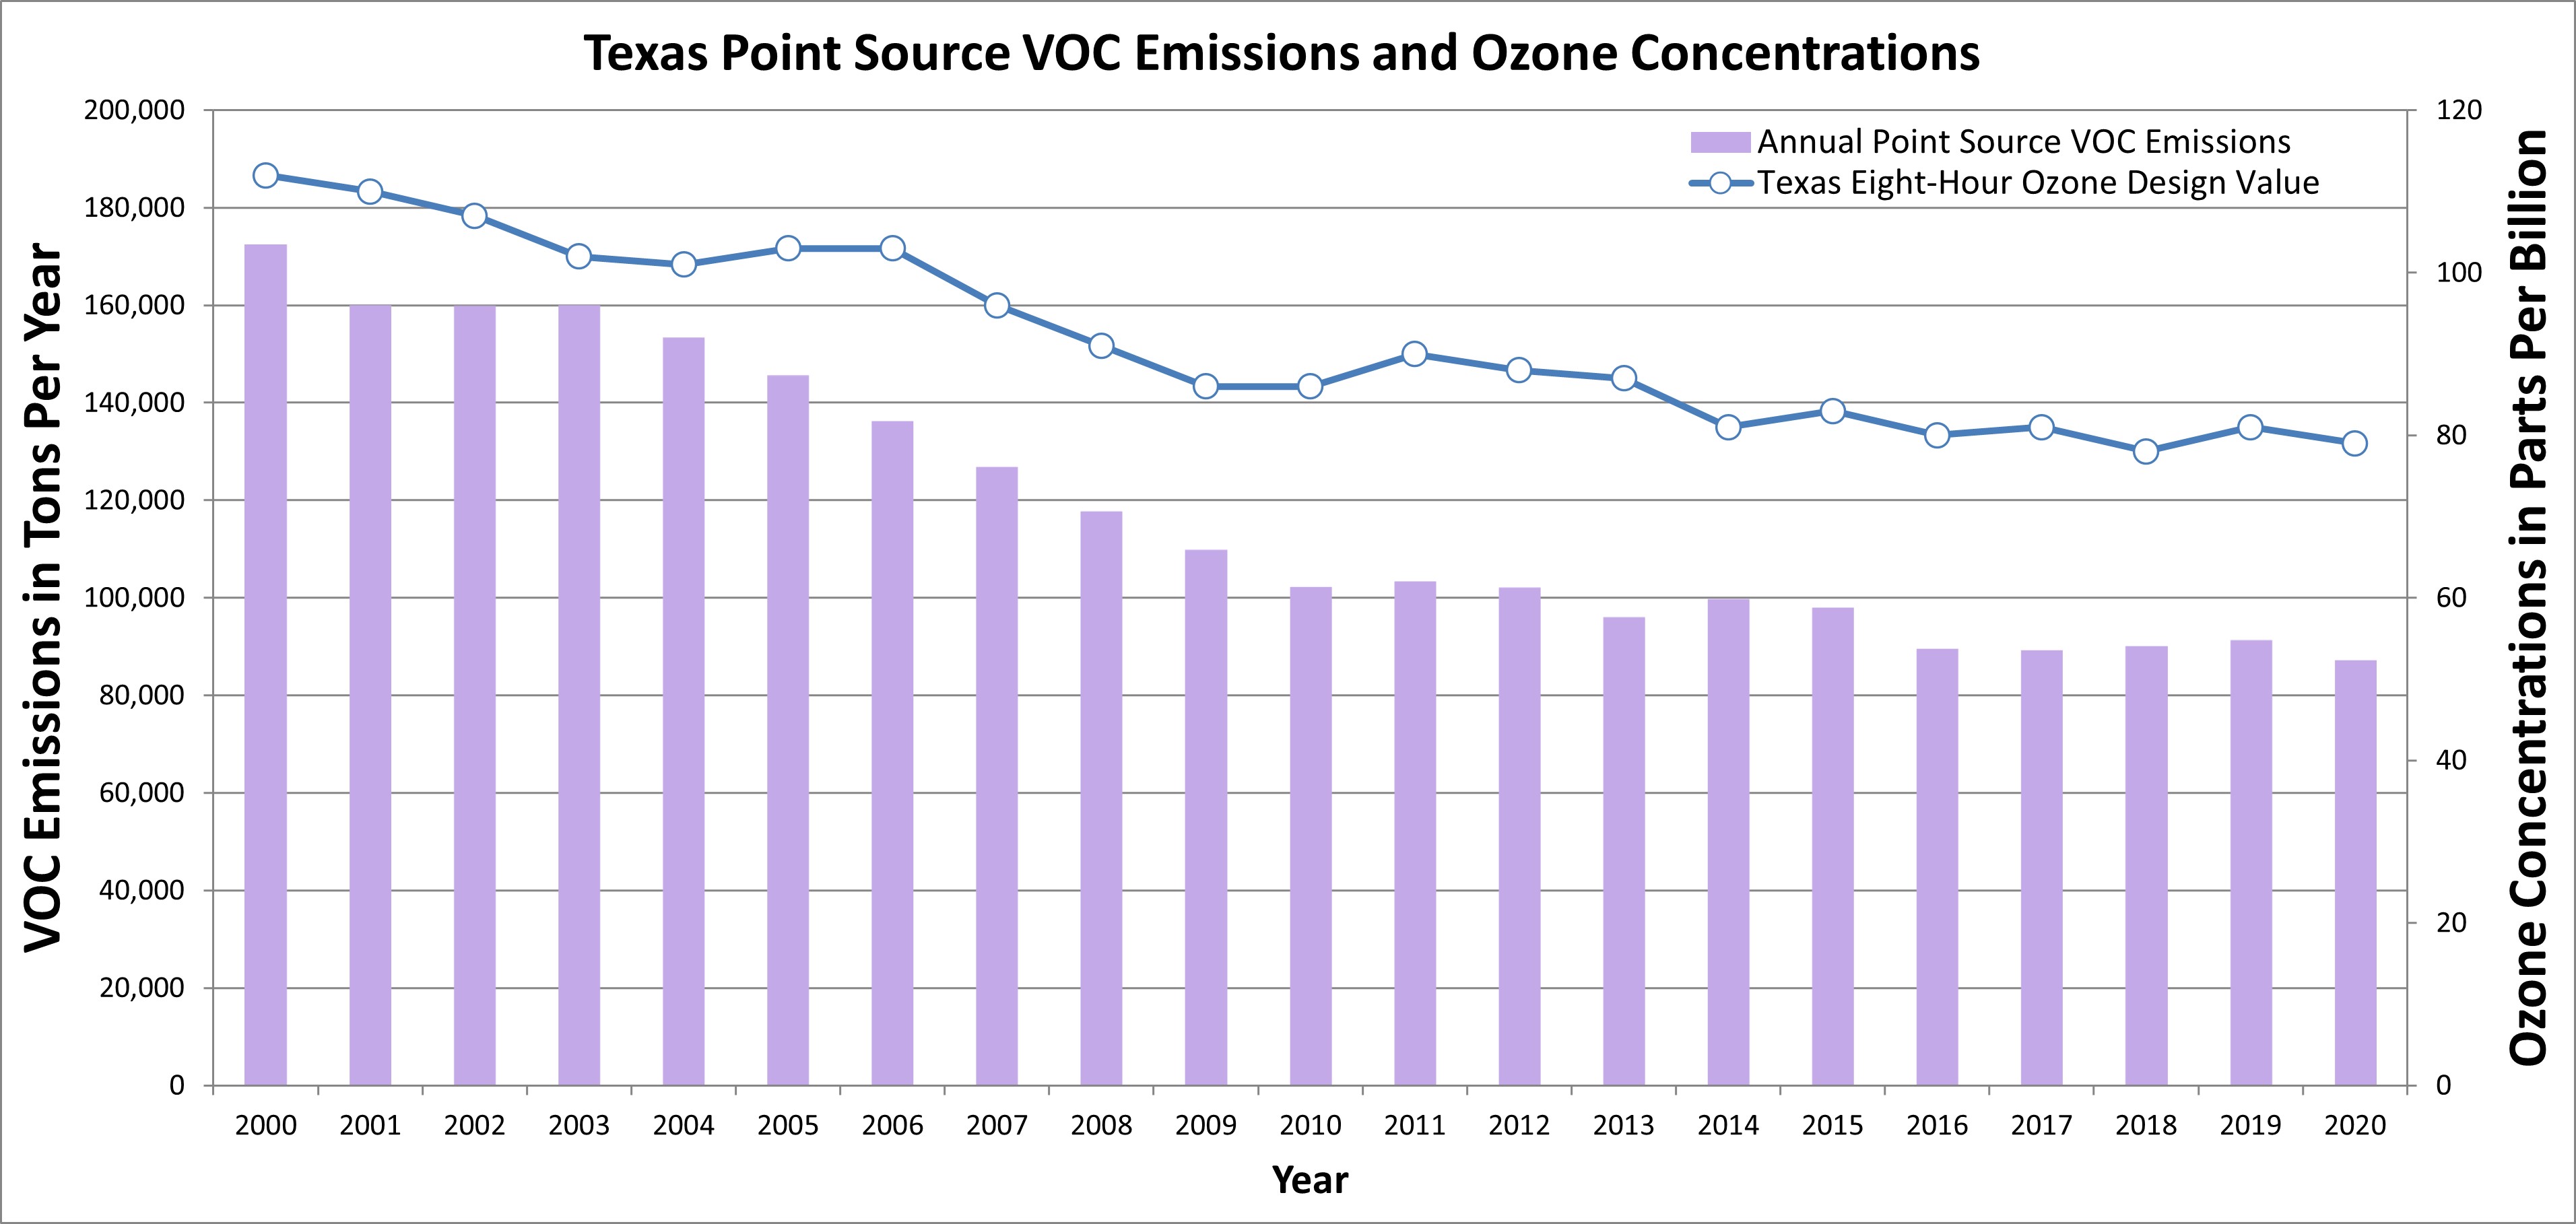
Image of VOC emissions in Texas compared to ozone concentrations.
