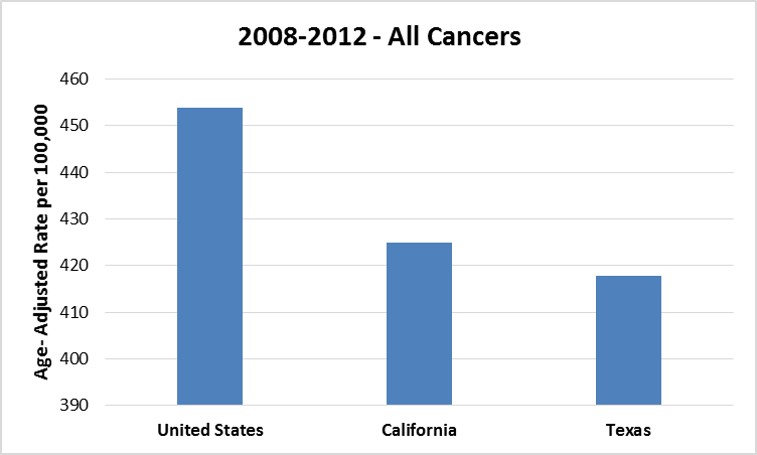
Age-adjusted rates per 100,000 for all cancers for 2008–2012 in the United States, California, and Texas.
Bar graph of the age-adjusted rates per 100,000 for all cancers for 2008–2012 in the United States, California, and Texas.
Search tceq.texas.gov
Bar graph of the age-adjusted rates per 100,000 for all cancers for 2008–2012 in the United States, California, and Texas.
