Age-adjusted rates per 100,000 for all cancers for 2008–2012 in TexasLine graph that shows age-adjusted rates per 100,000 for all cancers for 2008–2012 in Texas.https://www.tceq.texas.gov/downloads/toxicology/images/fig3_cancer_incidence_texas.jpg/viewhttps://www.tceq.texas.gov/downloads/toxicology/images/fig3_cancer_incidence_texas.jpg/@@images/image-1200-8abe135309f4c273d34f2ef1c44fecef.jpeg?v=image
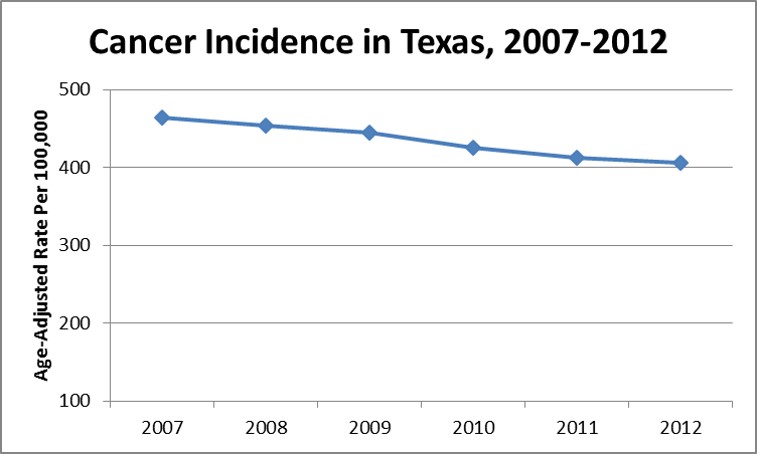
Age-adjusted rates per 100,000 for all cancers for 2008–2012 in Texas
Line graph that shows age-adjusted rates per 100,000 for all cancers for 2008–2012 in Texas.
