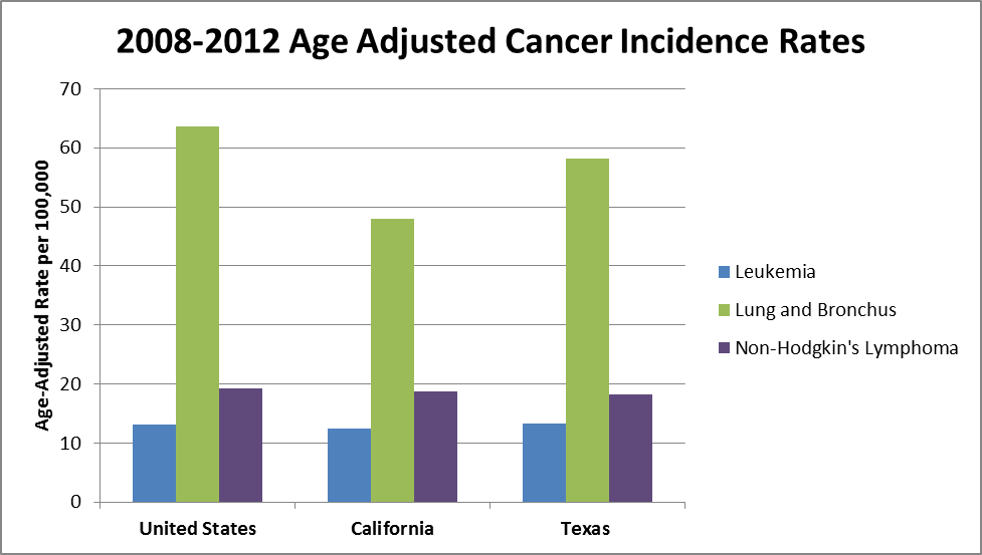
Age-adjusted rates per 100,000 for leukemia, lung and bronchus and Non-Hodgkin’s lymphoma for 2008–2012 in Texas
Bar graph that shows age-adjusted rates per 100,000 for leukemia, lung and bronchus and Non-Hodgkin’s lymphoma for 2008–2012 in Texas.
Search tceq.texas.gov
Bar graph that shows age-adjusted rates per 100,000 for leukemia, lung and bronchus and Non-Hodgkin’s lymphoma for 2008–2012 in Texas.
