1,3 Butadiene Annual Average Concentrations Across Houston
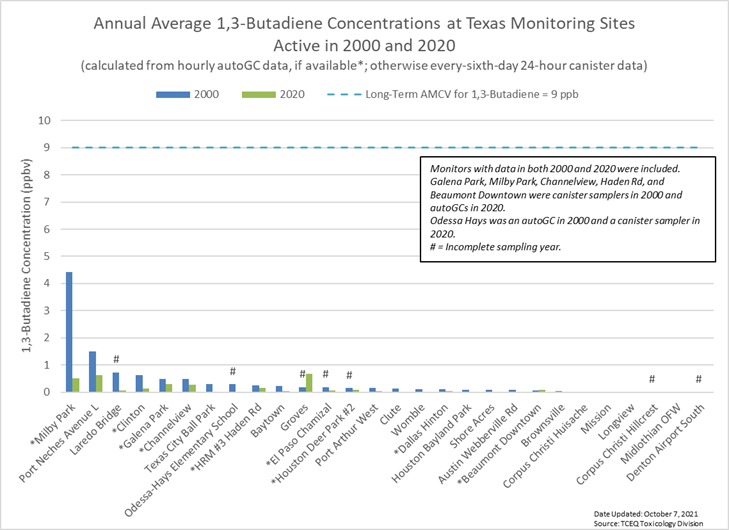
This page contains a graph showing the annual average 1,3 butadiene concentrations at Houston monitoring sites active in 2000 and 2020.
Search tceq.texas.gov
This page contains a graph showing the annual average 1,3 butadiene concentrations at Houston monitoring sites active in 2000 and 2020.
