Sulfur Dioxide Dispersion Modeling for Hutchinson County
Air dispersion modeling methods, files, and data to support the Hutchinson County sulfur dioxide attainment demonstration for the State Implementation Plan (SIP) revision.
A portion of Hutchinson County does not meet the 2010 Sulfur Dioxide (SO2) National Ambient Air Quality Standard (NAAQS) . TCEQ has developed a plan to demonstrate how the area will meet the SO2 standard. Below is TCEQ's dispersion modeling that was used for developing the plan, including a description of the pollution sources and the surrounding area.
If you have questions about these files, please email amda@tceq.texas.gov with "Hutchinson County SO2 Dispersion Modeling Files" in the subject line.
Area Overview
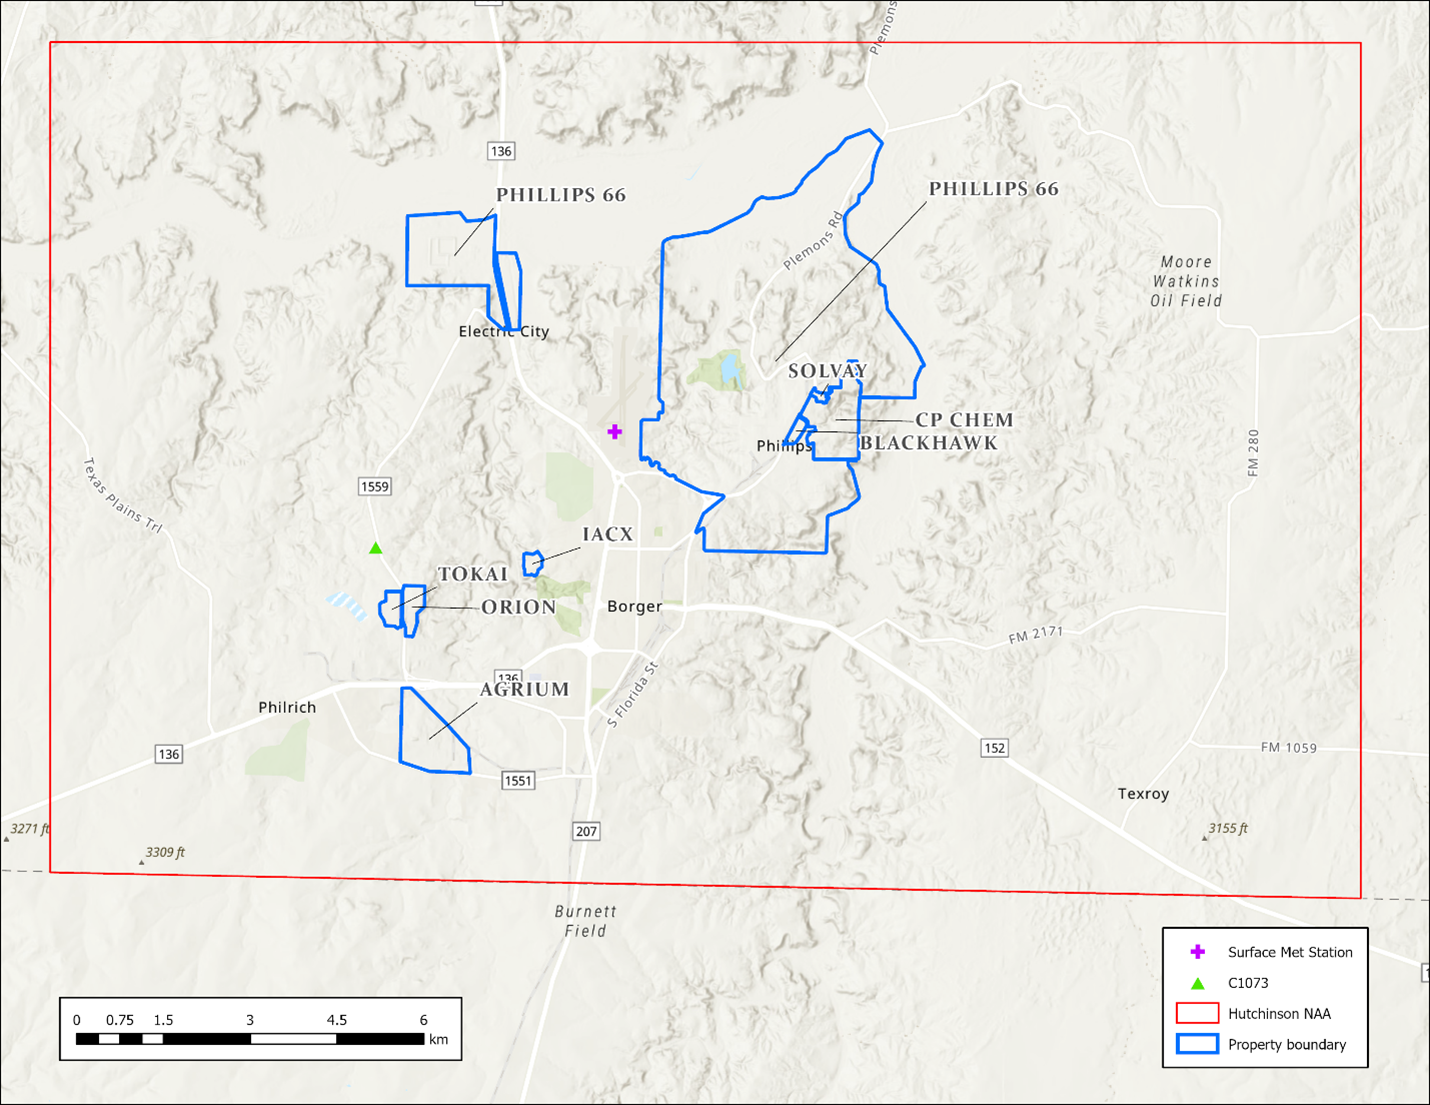
The Hutchinson County 2010 SO2 NAAQS nonattainment area contains eight sites (outlined in blue on the map), each with multiple sources of SO2 emissions that are included in the attainment demonstration modeling. The Borger FM 1559 monitor or Continuous Ambient Monitoring Station 1073 (C1073) is required under the Data Requirements Rule , and was sited (green triangle on the map) to monitor SO2 concentrations near the Tokai Borger Carbon Black Plant and Orion Borger Carbon Black Plant. The surface meteorology station used for this modeling (purple plus-sign on the map) is the Borger Hutchinson Airport (WBAN 03024), and the upper air data used is from the Amarillo Airport (WBAN 23047).
Model Configuration
The sources for the Howard County 2010 SO2 NAAQS nonattainment area were modeled with the standard practices outlined in Appendix W, Guideline on Air Quality Models .
Air Dispersion Model: AERMOD version 21112
AERMOD Preprocessors:
- AERMET version 21112 to generate meteorological data files.
- AERMINUTE version 15272 to include measured one-minute wind averages.
- AERSURFACE version 20060 to determine the surface characteristics for the meteorological station.
- AERMAP version 18081 to gather elevation data for sources and receptors.
- The Building Profile Input Program for PRIME (BPIPPRM) version 04274 to calculate building downwash effects.
Meteorological Years Modeled: 2016 though 2020
Background Concentration: The background SO2 concentration used for this modeling was calculated for each hour and season by averaging the 99th percentile hourly values for 2018 through 2020 from the Midlothian Old Fort Worth monitor (C52).
Modeling Data Files
You may view and download the model runs and control file inputs described below from the TCEQ Air Modeling secure FTP site . To download a large quantity of modeling files, please use an FTP client software, such as FileZilla , to access our secure FTP site:
- FTP address: sftp://amdaftp.tceq.texas.gov
- FTP directory: /SO2/Hutchinson/adoption/AERMOD
- User ID and password: Please sign up for a user account at https://amdaftp.tceq.texas.gov/user/
Data available includes:
- Ancillary inputs (downwash, meteorology, and receptor input data).
- Run directories containing control files and model output.
AERMOD and its preprocessor source code and executables are available on the US Environmental Protection Agency's website .
If you would like to request additional data related to the modeling done for this SIP revision, please email amda@tceq.texas.gov with "Hutchinson County SO2 Modeling Files - Data Request" in the subject line and specify which data you are requesting.
SIP Revision and Related Appendices
Documents for the SIP revision and appendices related to this modeling are below:
- Hutchinson County Attainment Demonstration SIP Revision for the 2010 SO2 NAAQS
- Appendix J: Modeling Technical Support Document (TSD)
For more on this SIP revision, visit the Air Pollution from Sulfur Dioxide webpage.