Skip to Content
Questions or Comments: psinvent@tceq.texas.gov

Texas Emission Sources - A Graphical Representation

The following pie charts show the relative emissions of nitrogen oxides (NOx) and volatile organic compounds (VOCs) for Texas urban areas by source category. The charts are developed every three years based on the National Emissions Inventory.

2020 Emission Source Categories:

  • Point Sources: Typically large, industrial, stationary sources, such as refineries, chemical plants, and power plants. Point sources meet the reporting requirements of 30 Texas Administrative Code §101.10 and submit annual emission inventories to the TCEQ.
  • Area Sources: Generally small, stationary, industrial, commercial, and residential sources, such as gas stations or home heating. Area source emissions may come from materials or activities at a site. These sites are stationary emissions sources that do not meet the reporting requirements for point sources. The TCEQ estimates Texas area source emissions every three years for the National Emissions Inventory .
  • Mobile Sources: Include on-road sources such as cars, trucks, motorcycles, and other vehicles certified for highway use. They also include non-road sources that typically do not operate on highways, such as planes, trains, drilling rigs, commercial boats, and equipment used for agriculture, industry, construction, mining, and commercial lawn maintenance. The TCEQ estimates Texas mobile source emissions every three years for the National Emissions Inventory and has programs to help reduce mobile source emissions.

2020 Emissions and Sources for Texas Urban Areas

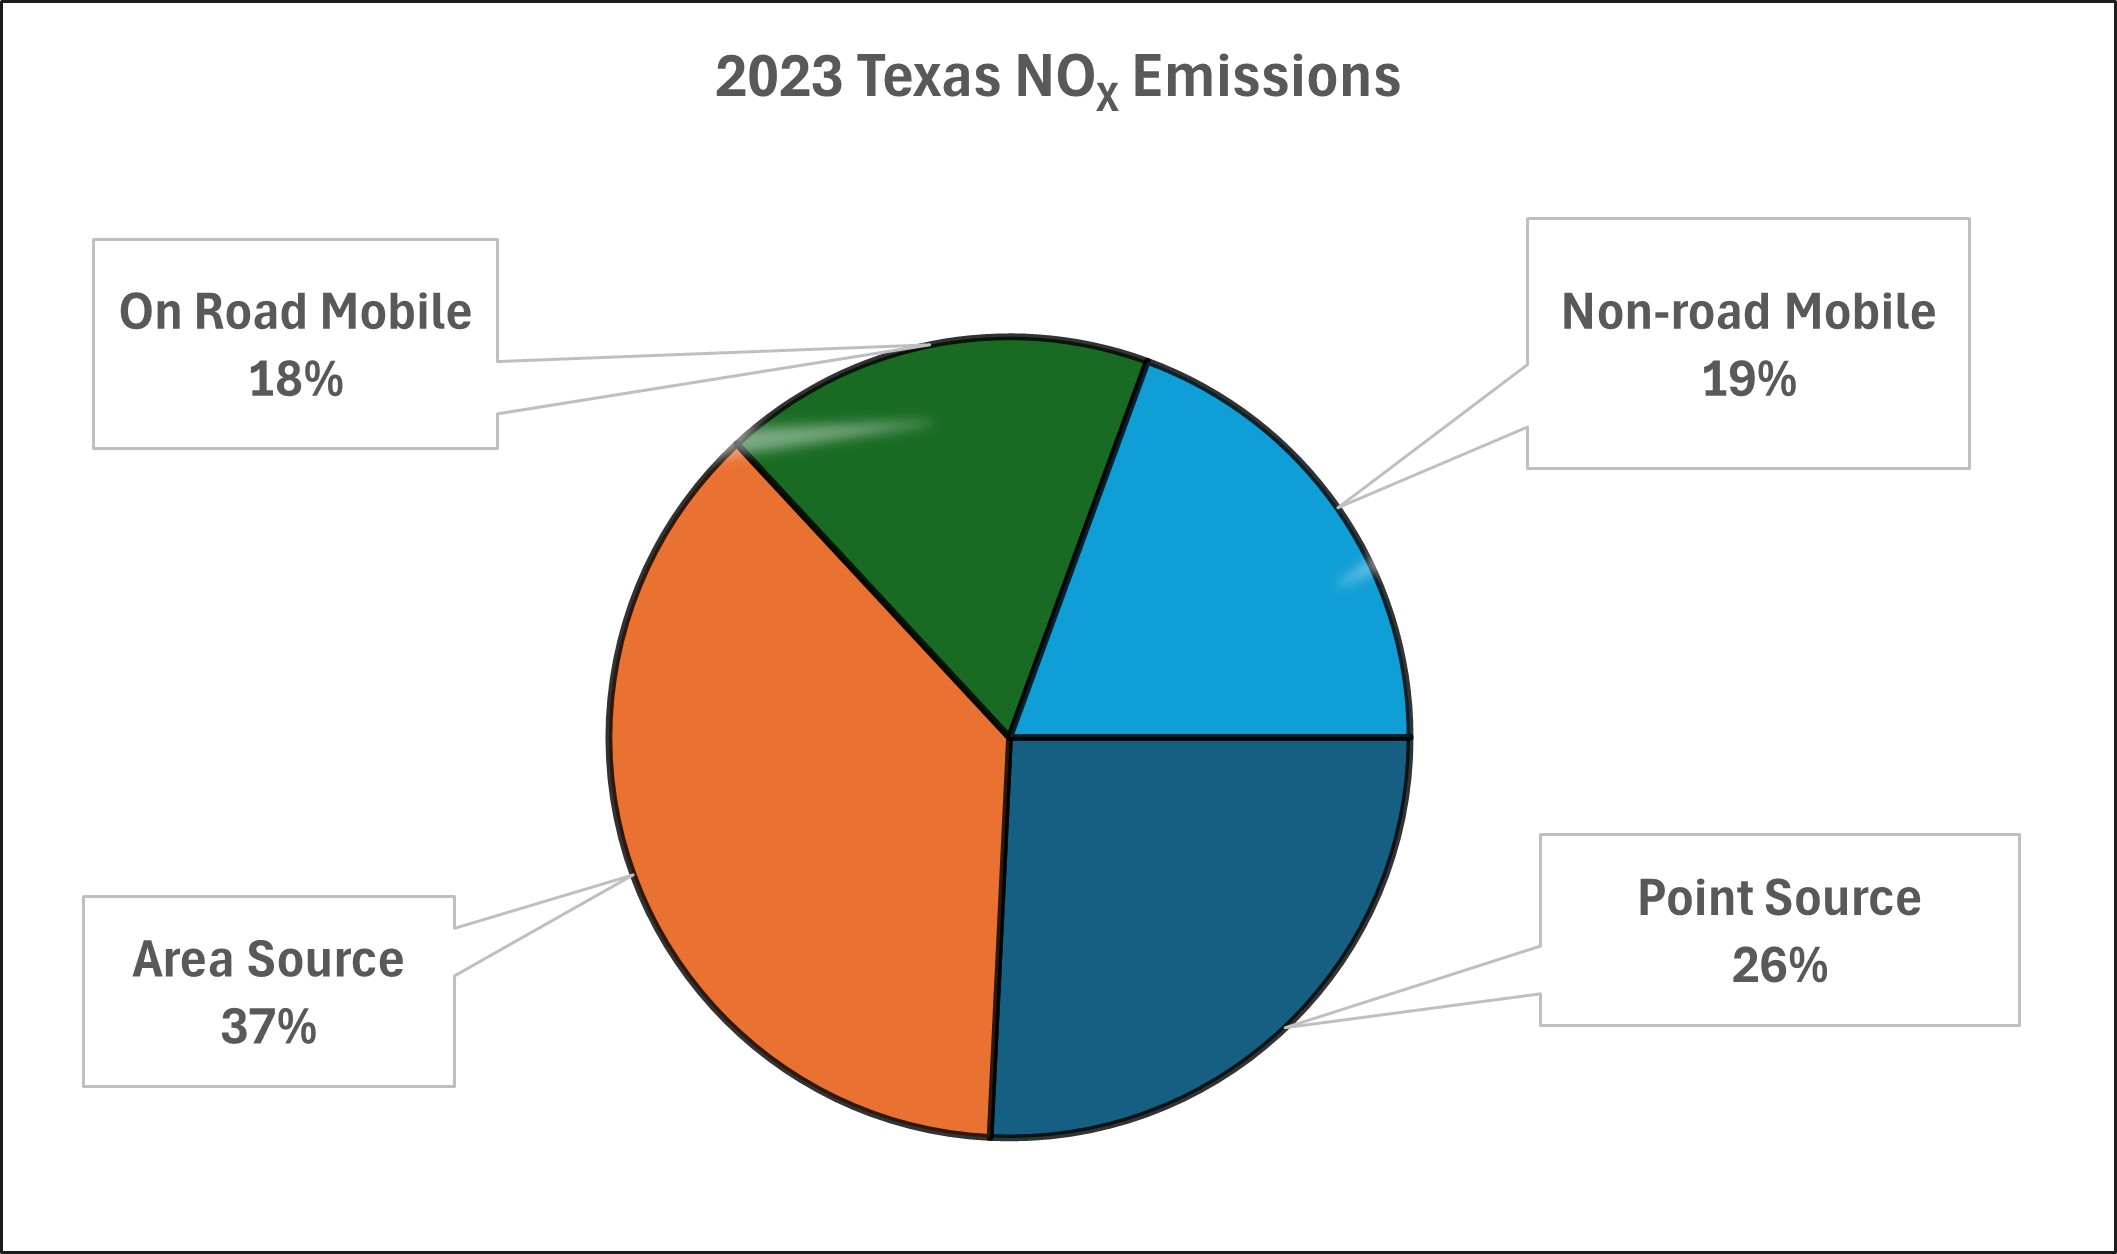
Statewide NOx Emissions and Sources

This chart represents calendar year 2020 nitrogen oxide emissions for the State of Texas. 39 percent of emissions are from mobile sources, 34 percent of emissions are from area sources, and 27 percent of emissions are from point sources.

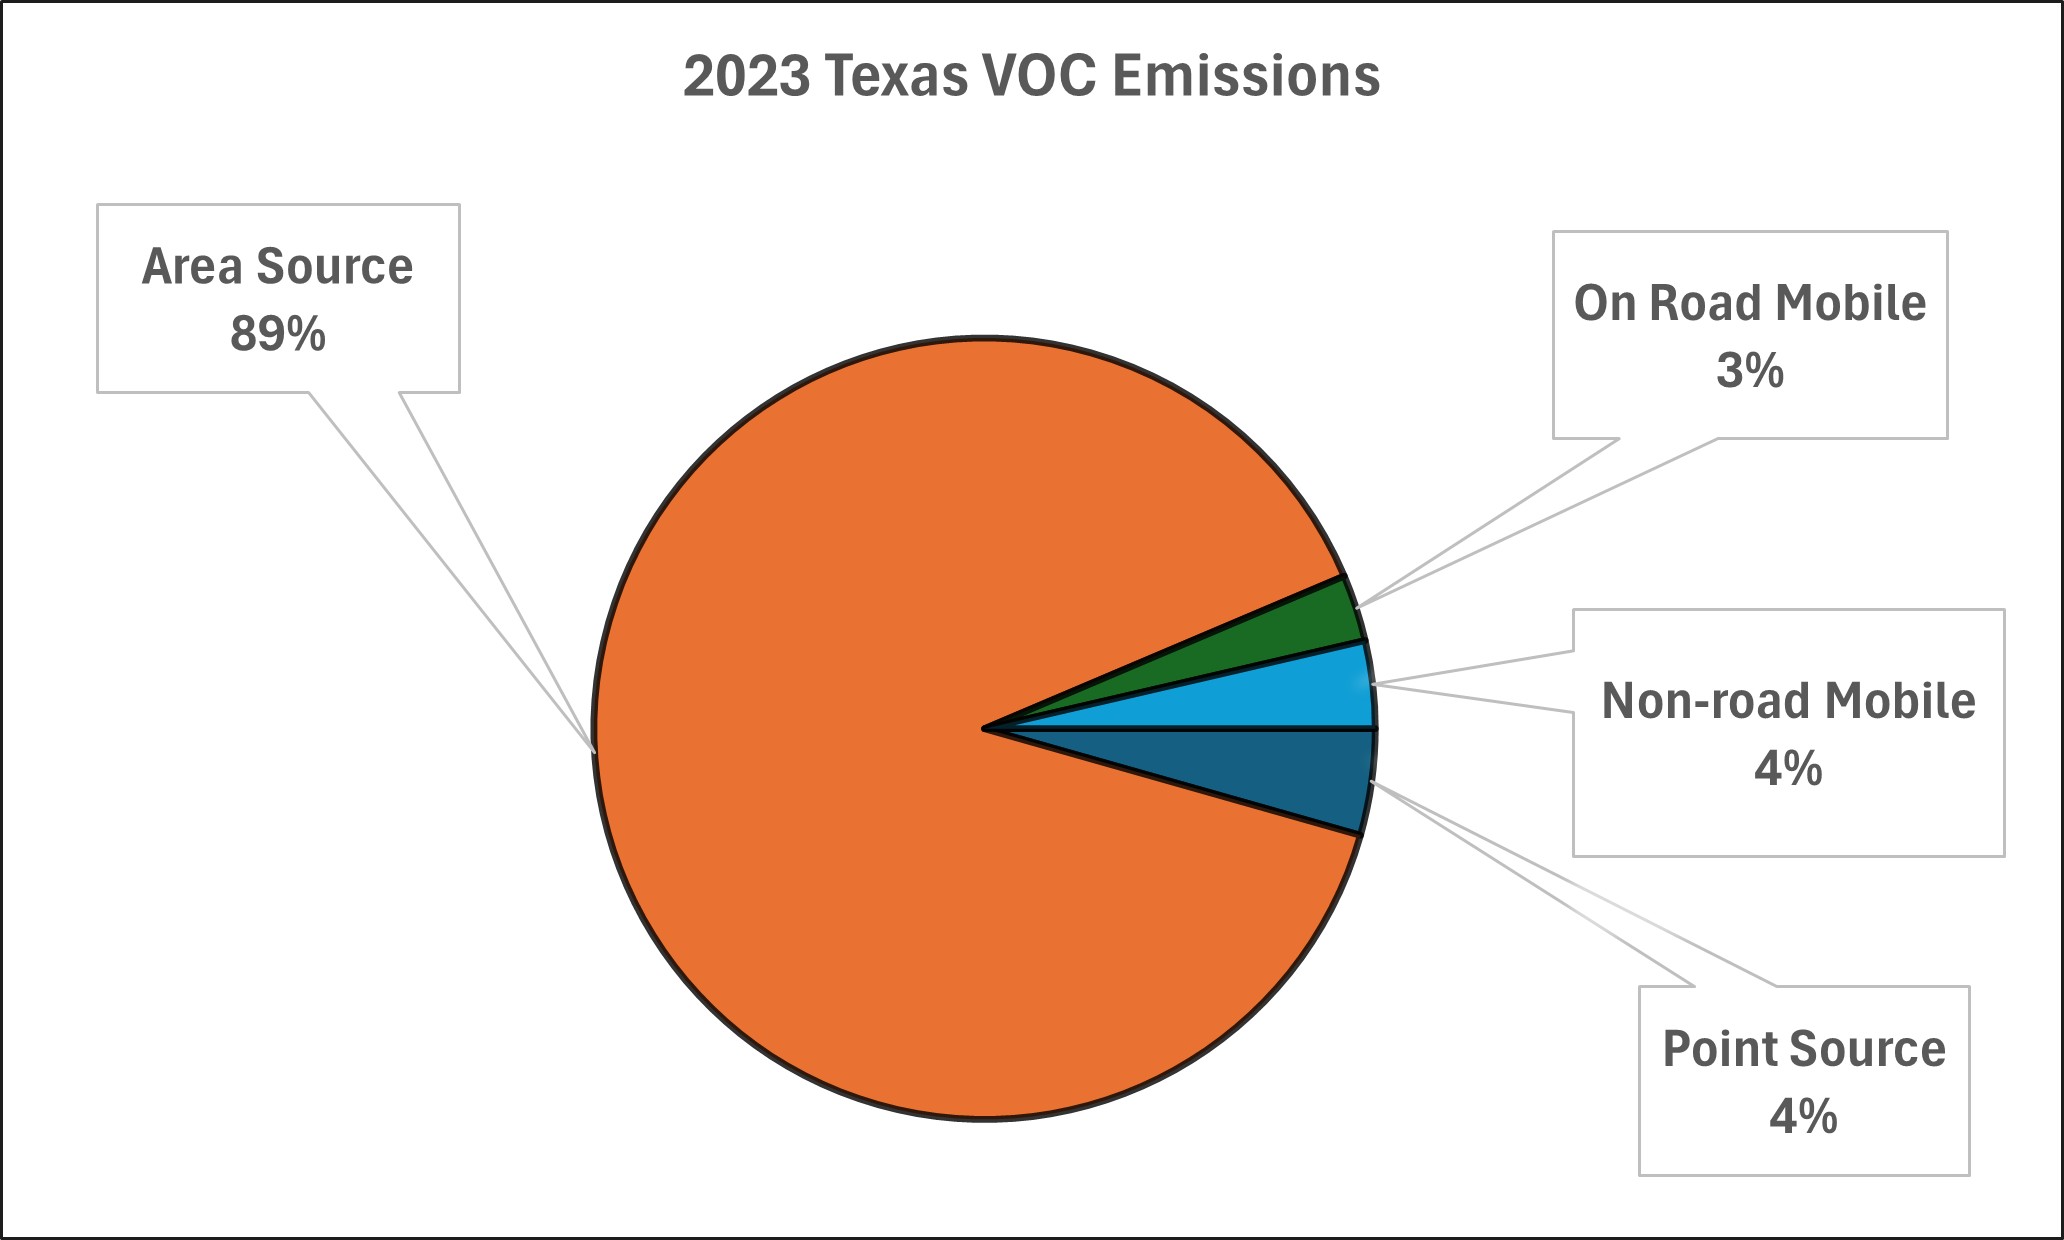
Statewide VOC Emissions and Sources

This chart represents calendar year 2020 volatile organic compound emissions for the State of Texas. 88 percent of emissions are from area sources, 7 percent of emissions are from mobile sources, and 5 percent of emissions are from point sources.

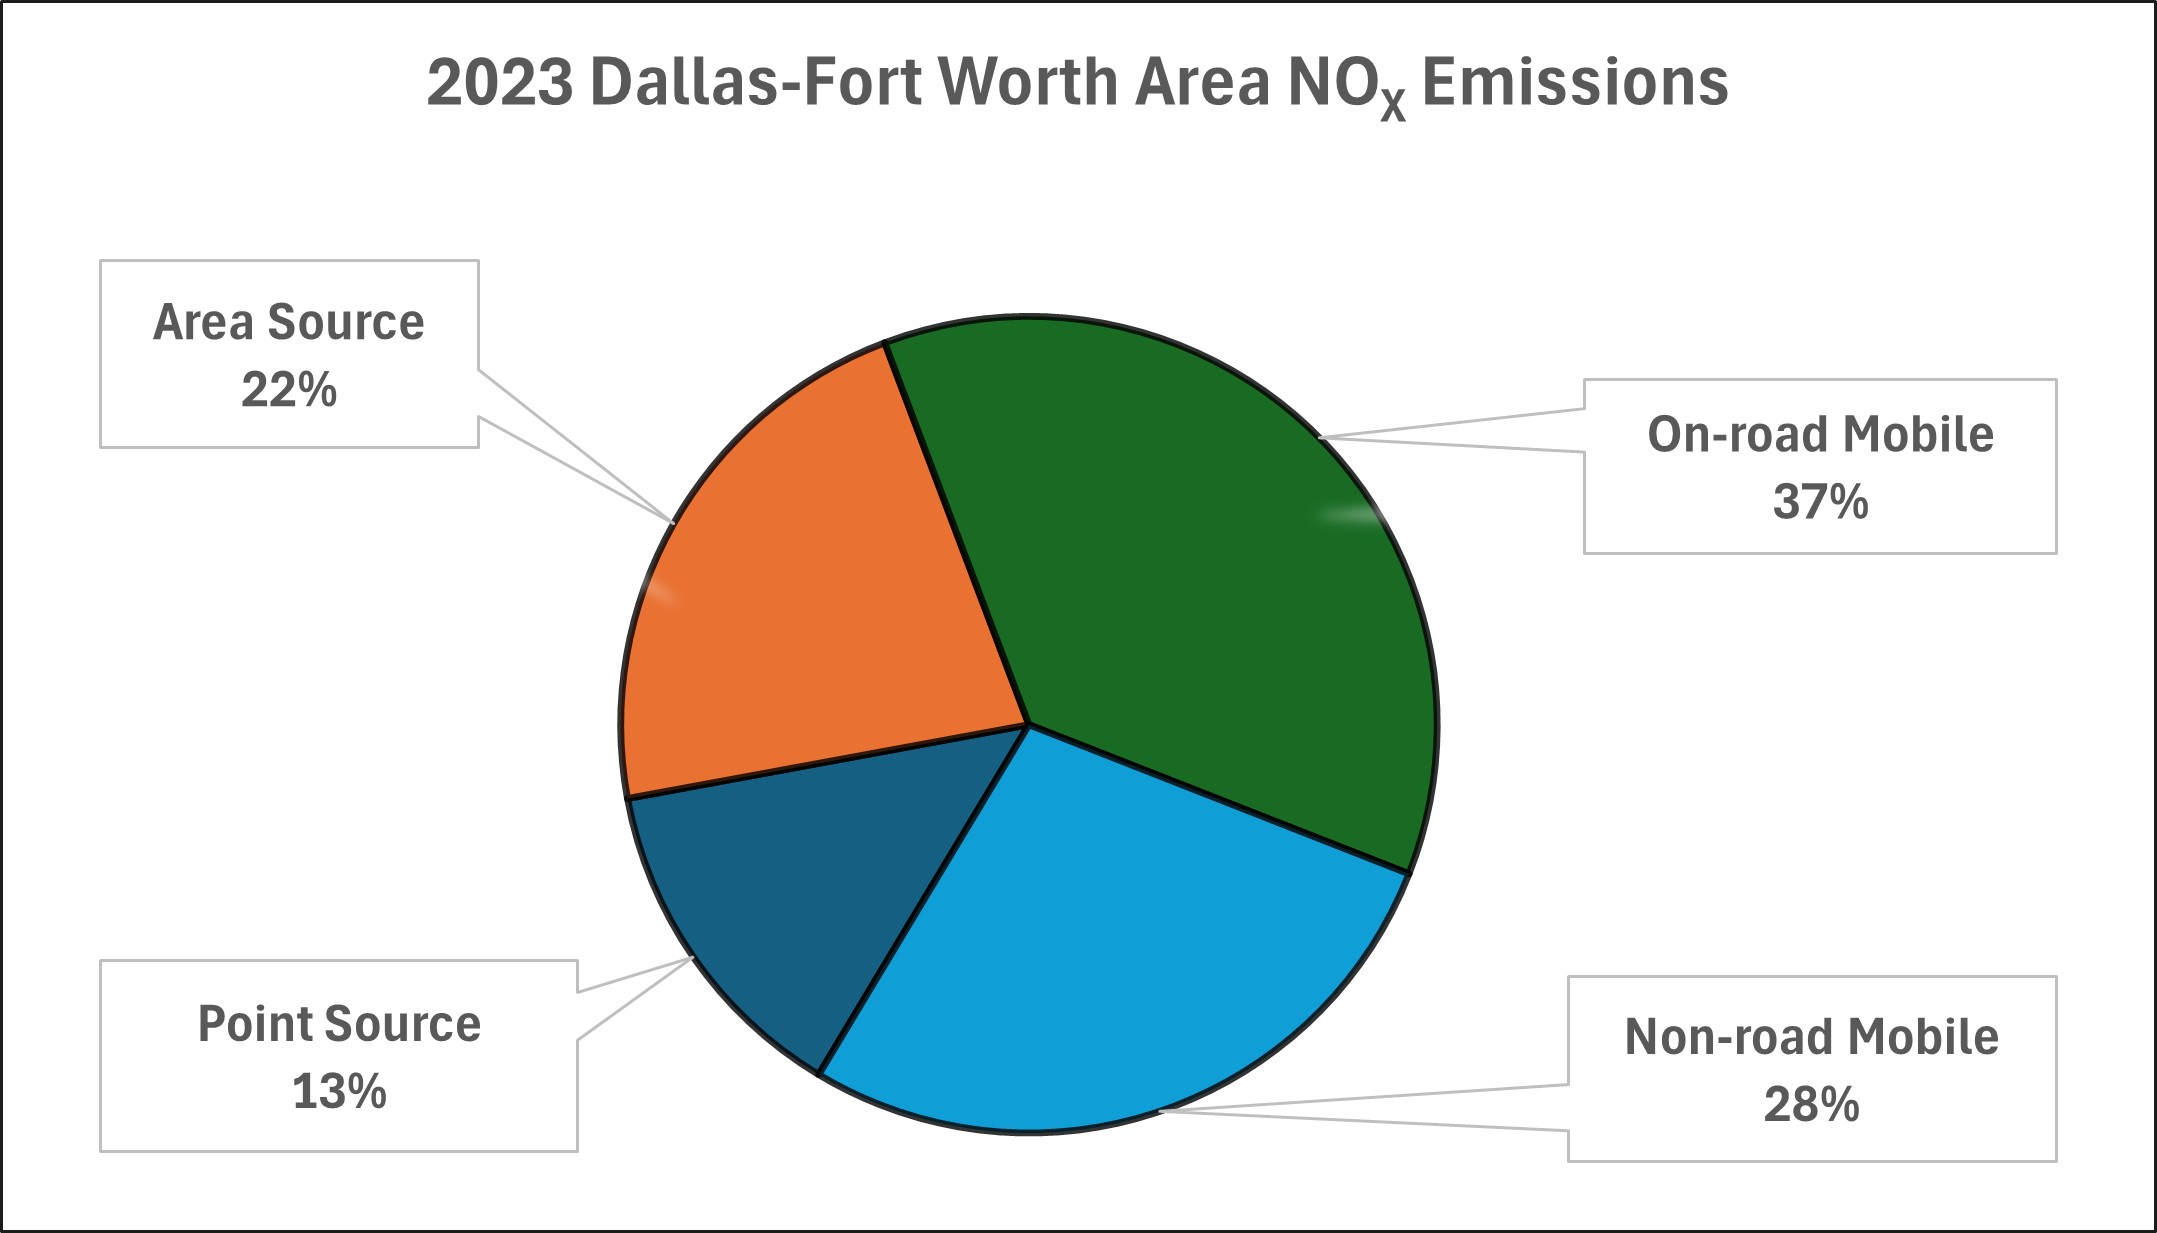
Dallas-Fort Worth NOX Emissions and Sources

This chart represents calendar year 2020 nitrogen oxide emissions for the 10-county Dallas-Fort Worth area. The DFW area includes Collin, Dallas, Denton, Ellis, Johnson, Kaufman, Parker, Rockwall, Tarrant, and Wise counties. 63 percent of emissions are from mobile sources, 23 percent of emissions are from area sources, and 14 percent of emissions are from point sources.

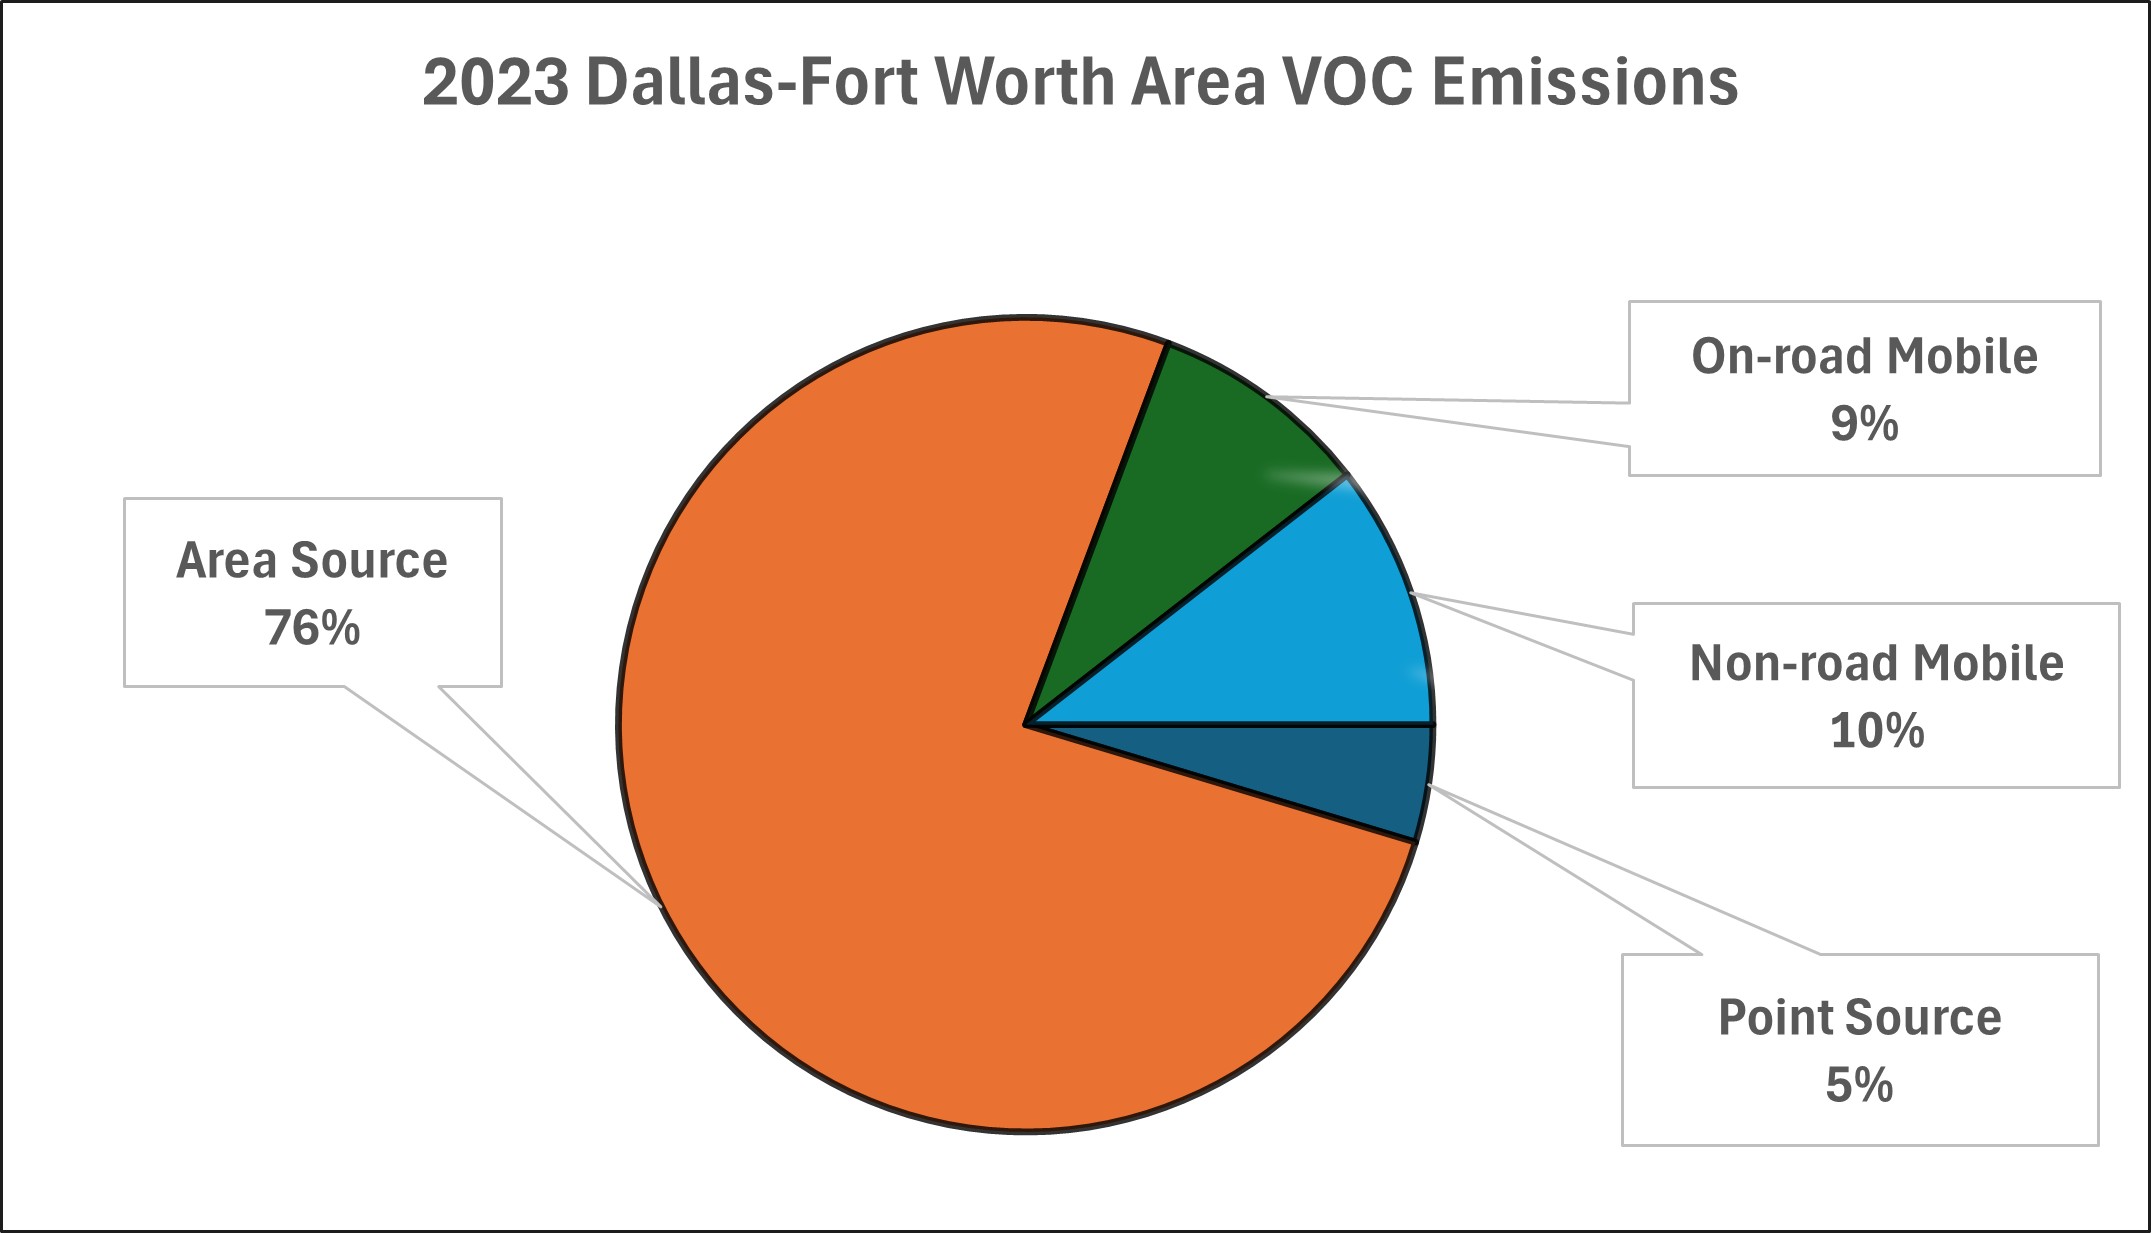
Dallas-Fort Worth VOC Emissions and Sources

This chart represents calendar year 2020 volatile organic compound emissions for the 10-county Dallas-Fort Worth area. The DFW area includes Collin, Dallas, Denton, Ellis, Johnson, Kaufman, Parker, Rockwall, Tarrant, and Wise counties. 76 percent of emissions are from area sources, 19 percent of emissions are from mobile sources, and 5 percent of emissions are from point sources.

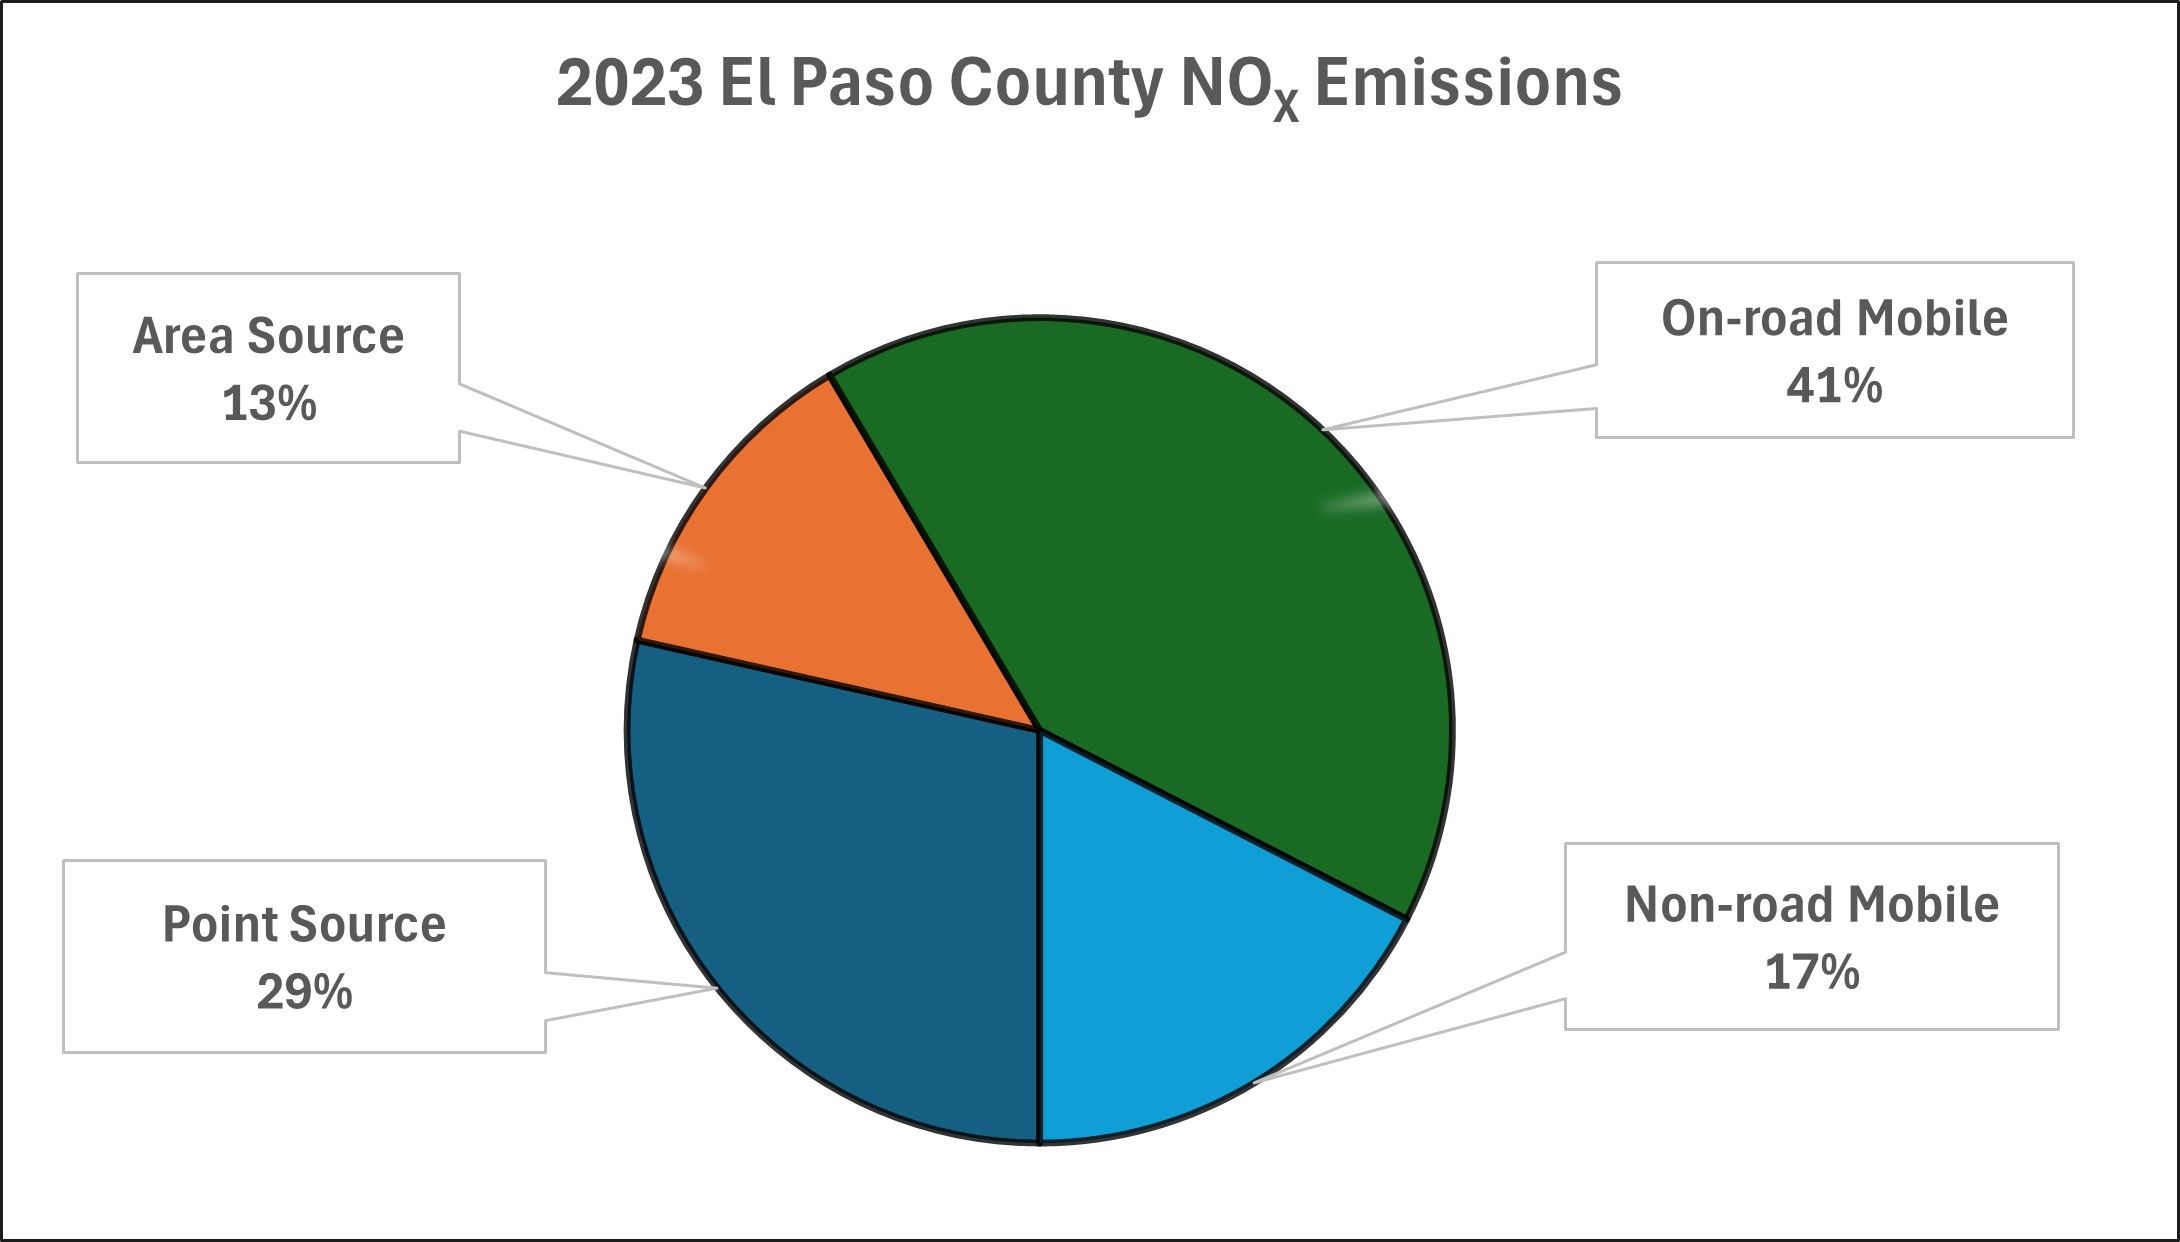
El Paso NOX Emissions and Sources

This chart represents calendar year 2020 nitrogen oxide emissions for El Paso County. 66 percent of emissions are from mobile sources, 22 percent of emissions are from point sources, and 12 percent of emissions are from area sources.

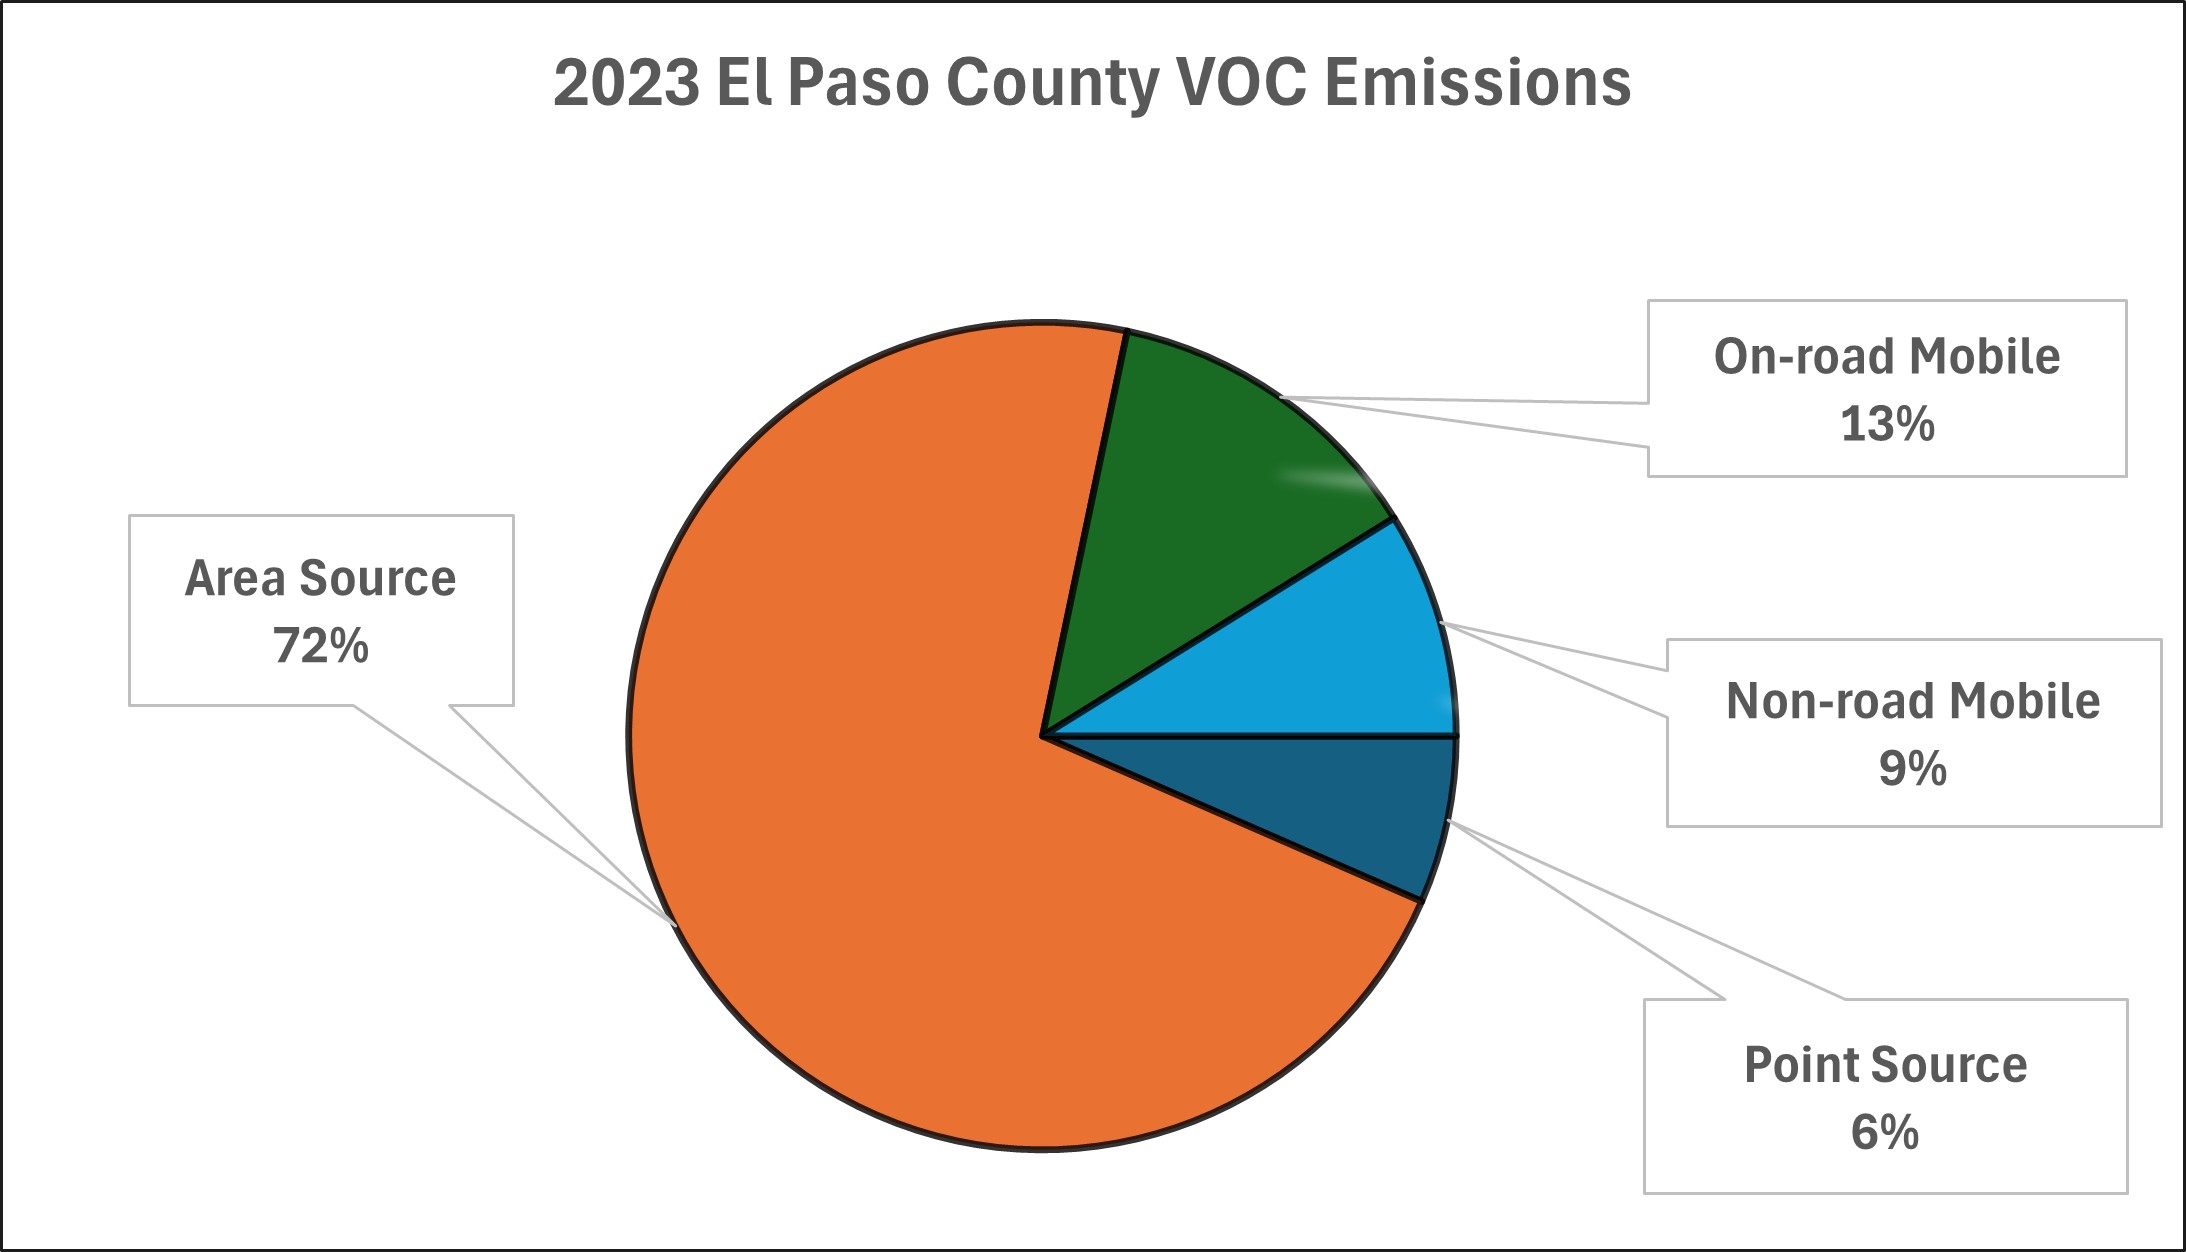
El Paso VOC Emissions and Sources

This chart represents calendar year 2020 volatile organic compound emissions for El Paso County. 69 percent of emissions are from area sources, 24 percent of emissions are from mobile sources, and 7 percent of emissions are from point sources.

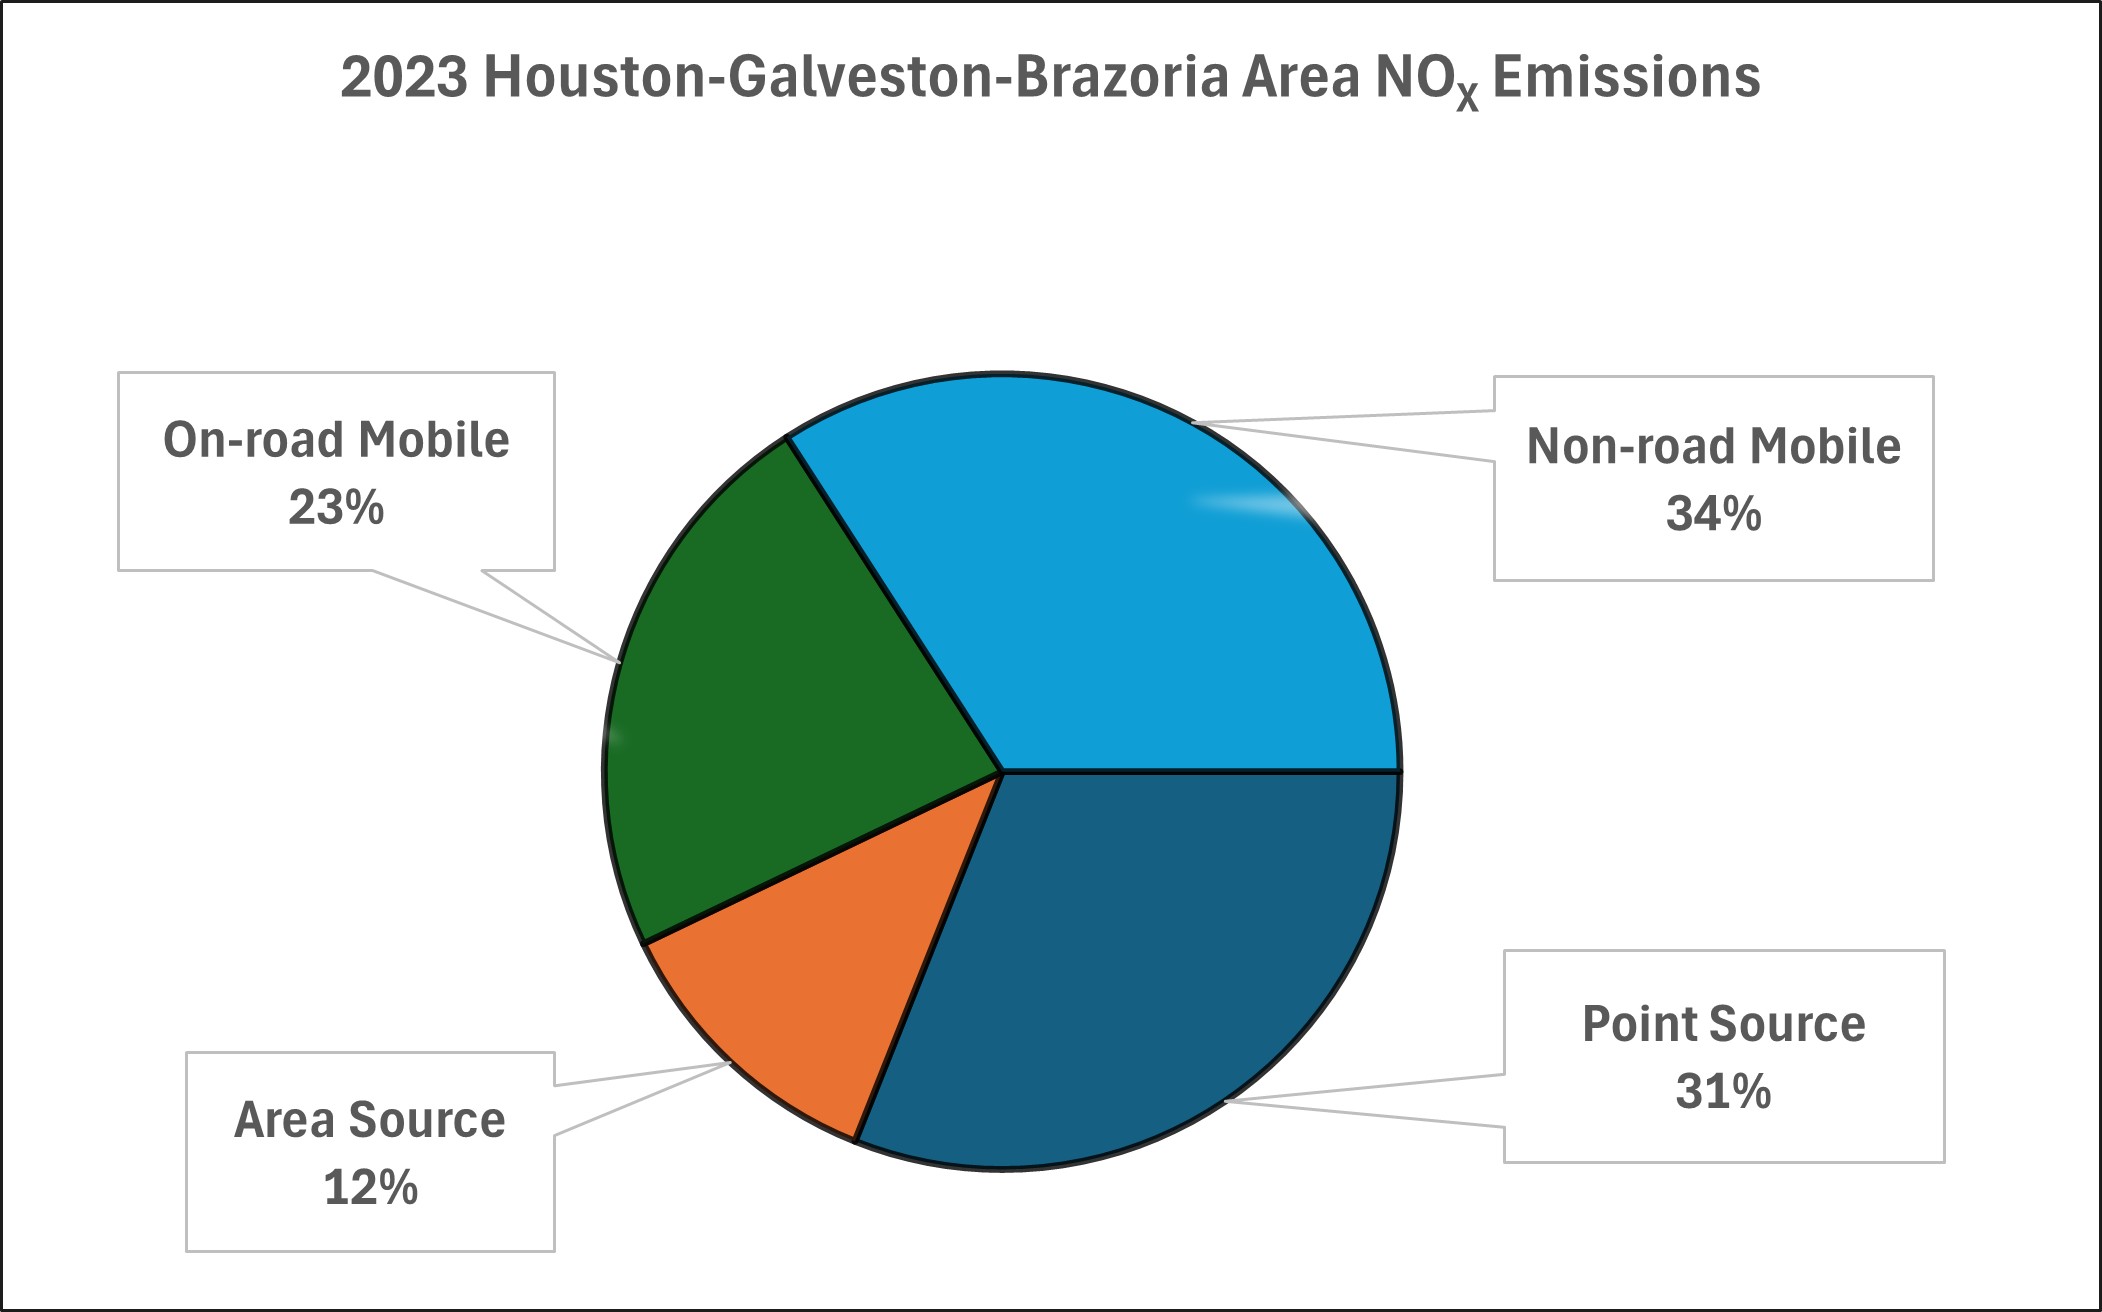
Houston-Galveston-Brazoria NOX Emissions and Sources

This chart represents calendar year 2020 nitrogen oxide emissions for the eight-county Houston-Galveston-Brazoria area. The HGB area includes Brazoria, Chambers, Fort Bend, Galveston, Harris, Liberty, Montgomery, and Waller counties. 57 percent of emissions are from mobile sources, 30 percent of emissions are from point sources, and 13 percent of emissions are from area sources.

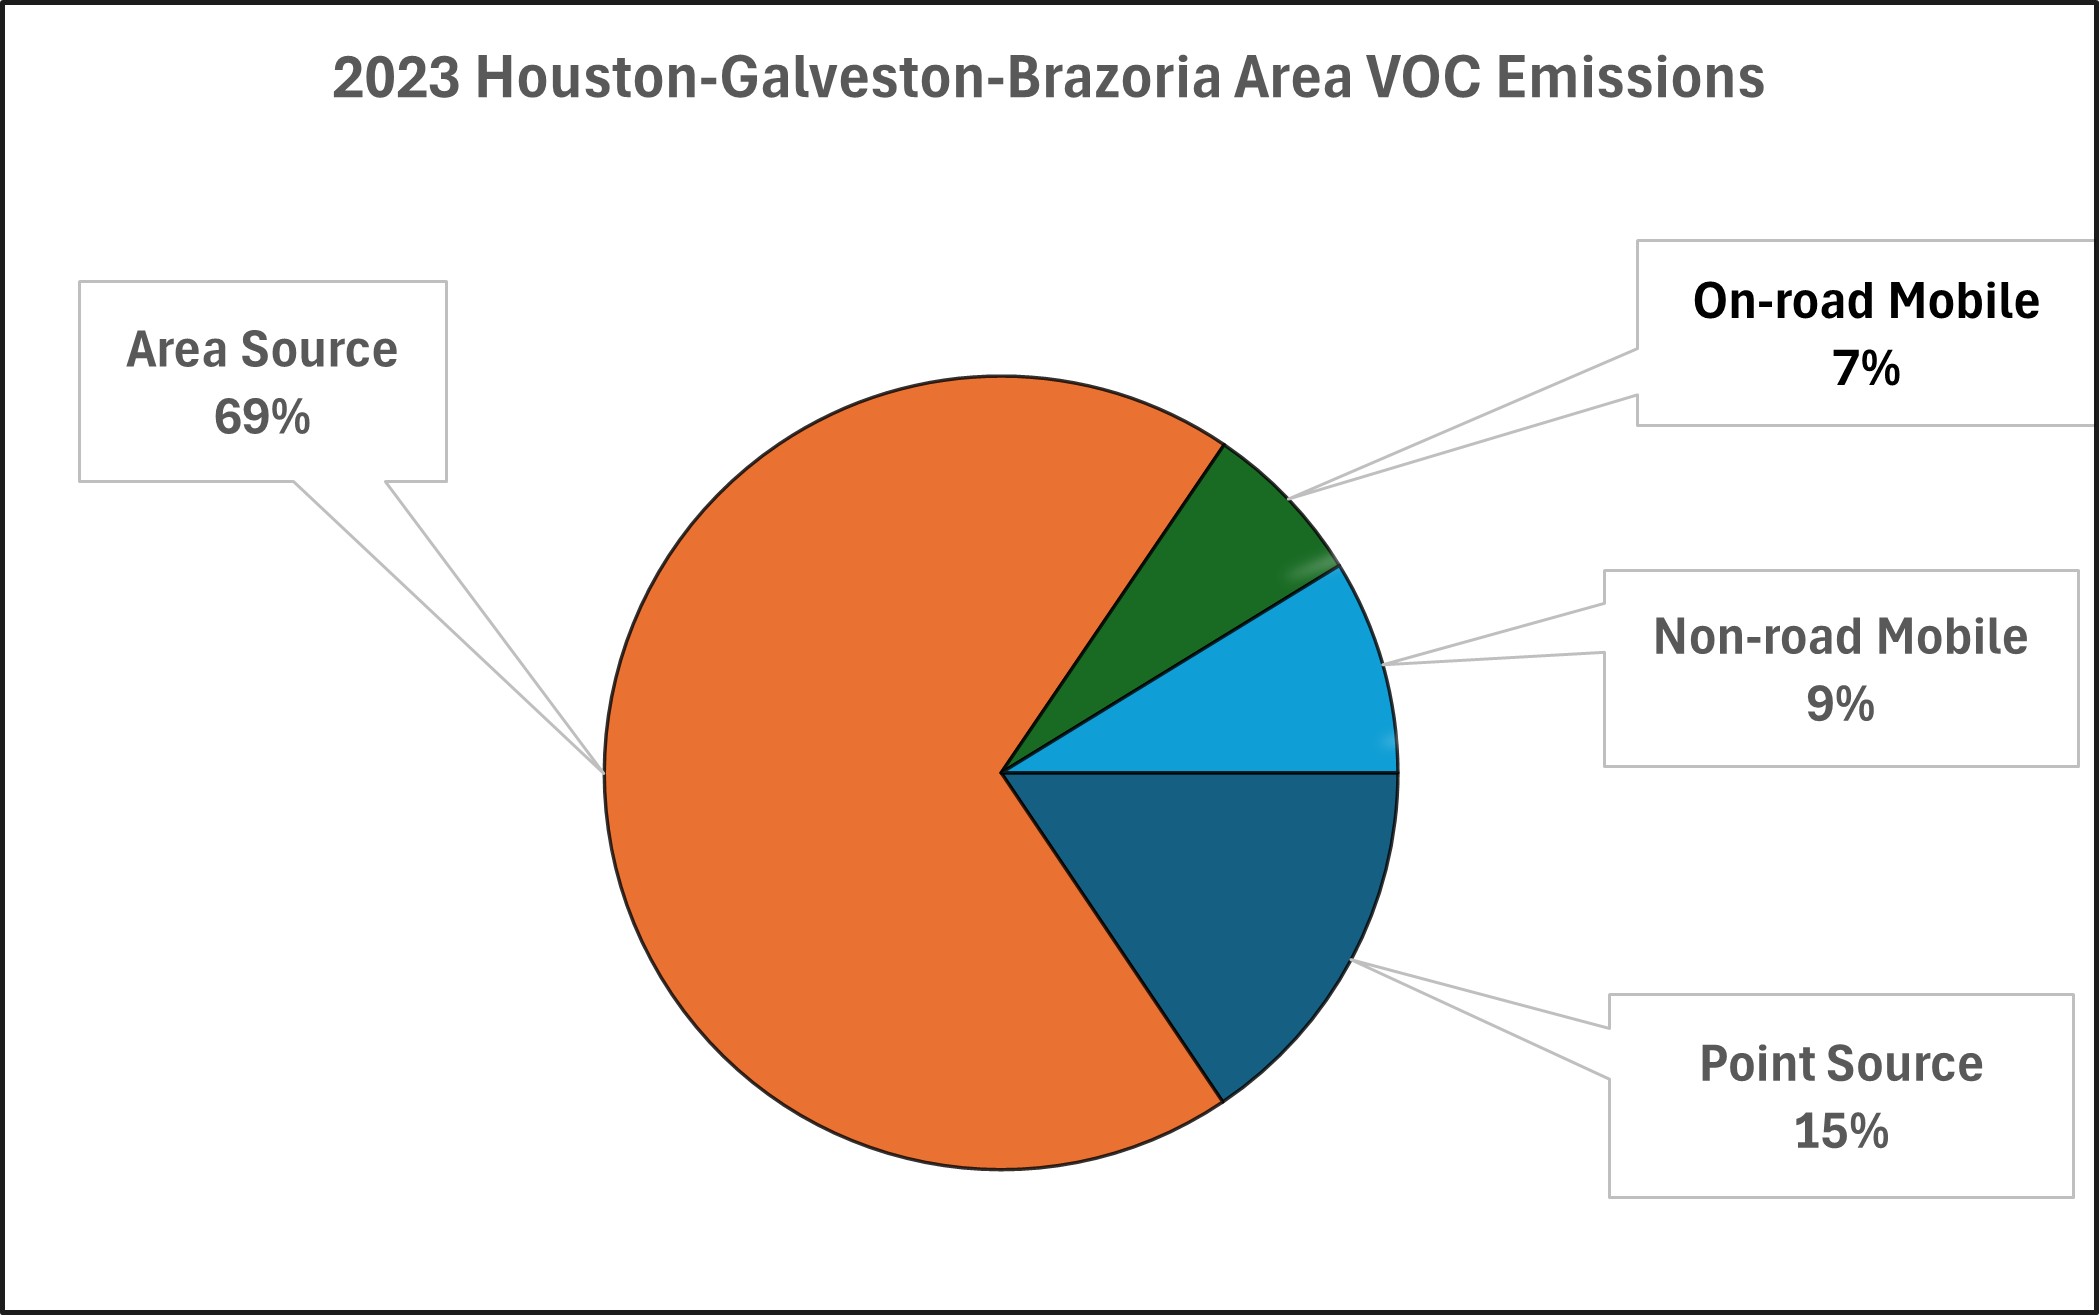
Houston-Galveston-Brazoria VOC Emissions and Sources

This chart represents calendar year 2020 volatile organic compound emissions for the eight-county Houston-Galveston-Brazoria area. The HGB area includes Brazoria, Chambers, Fort Bend, Galveston, Harris, Liberty, Montgomery, and Waller counties. 68 percent of emissions are from area sources, 16 percent of emissions are from mobile sources, and 16 percent of emissions are from point sources.

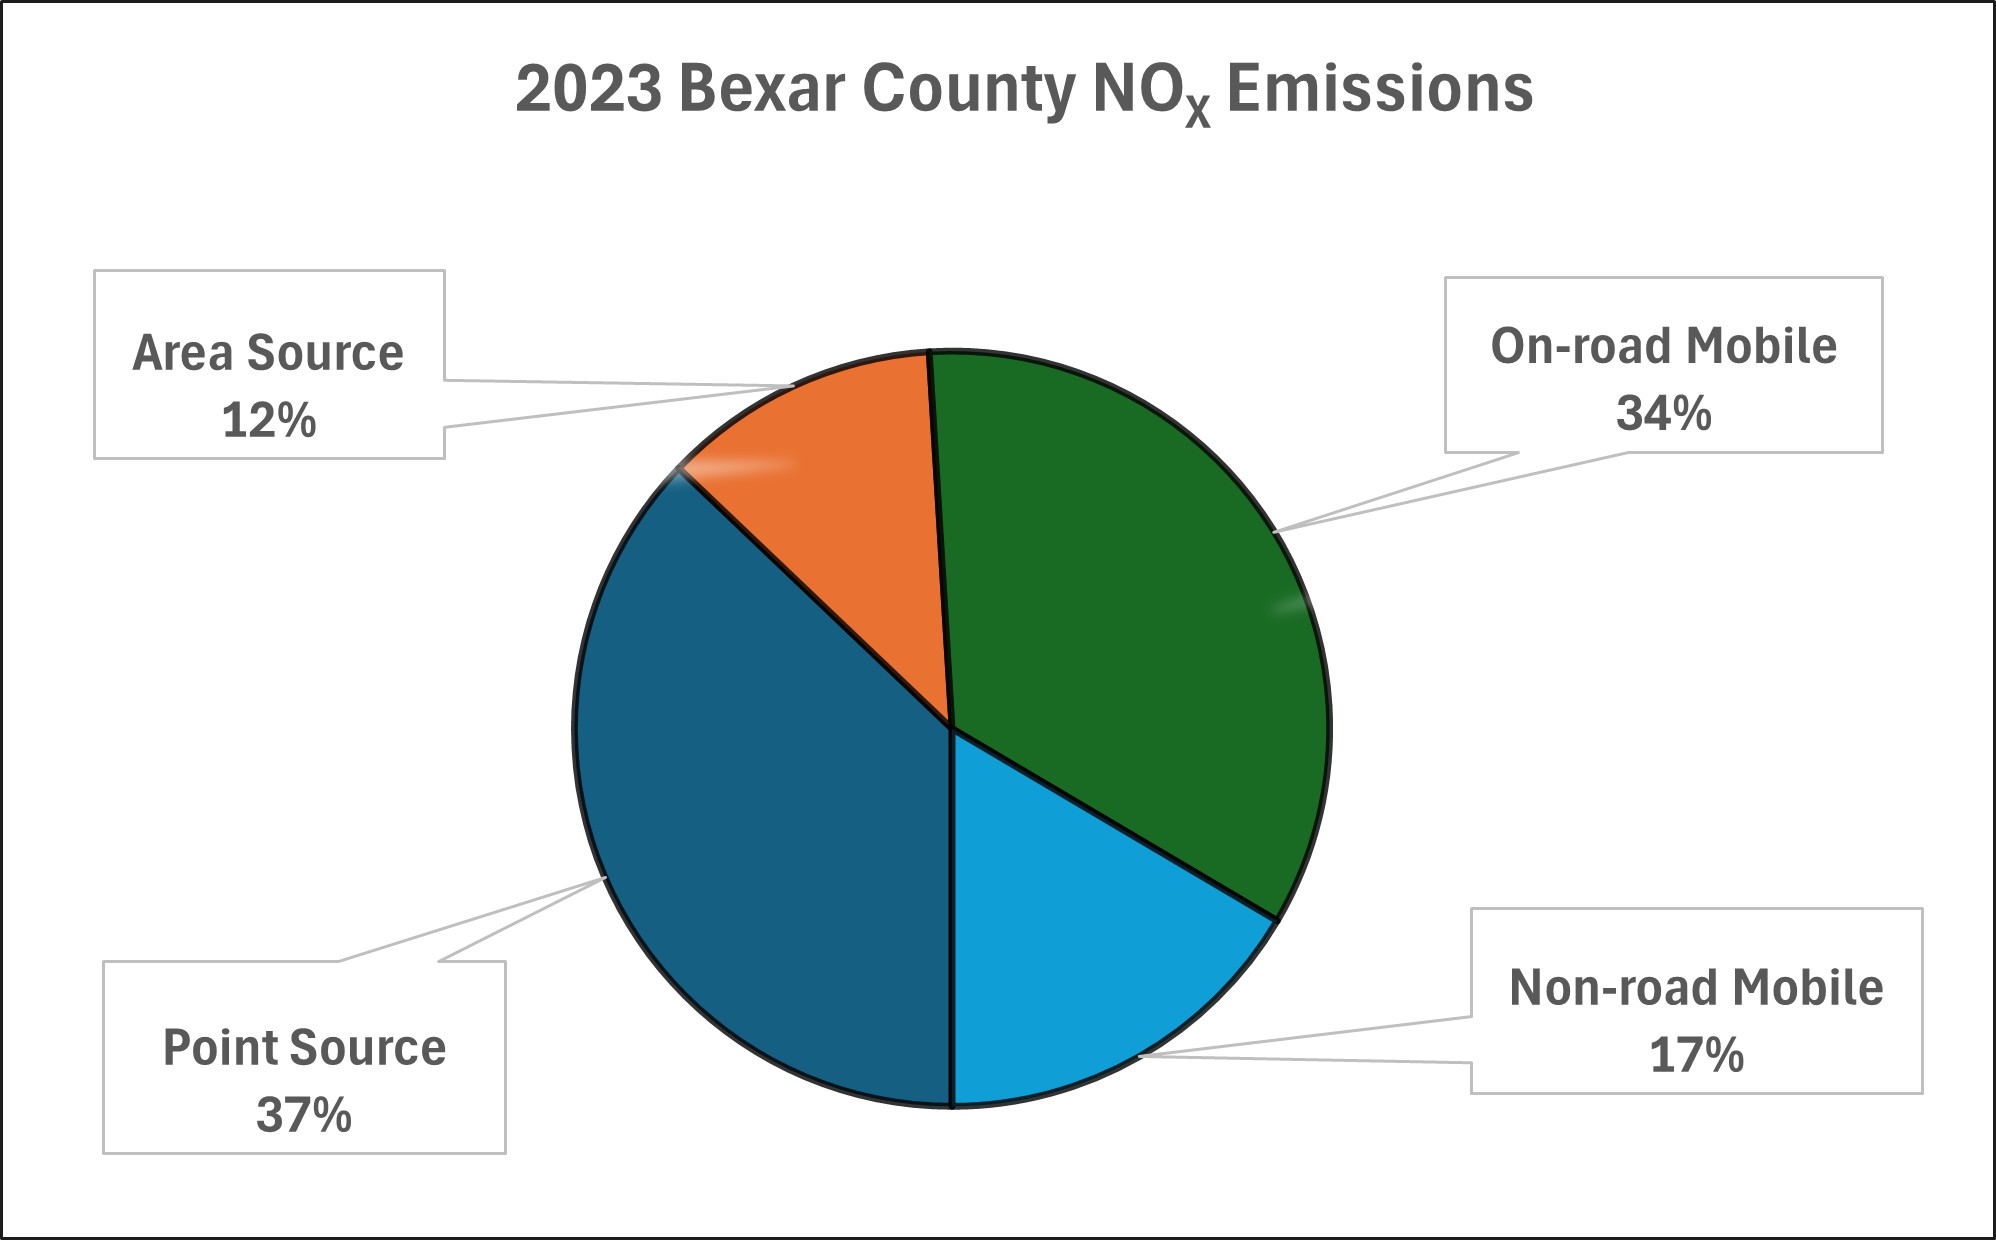
San Antonio NOX Emissions and Sources

This chart represents calendar year 2020 nitrogen oxide emissions for the Bexar County San Antonio area. 52 percent of emissions are from mobile sources, 36 percent of emissions are from point sources, and 12 percent of emissions are from area sources.

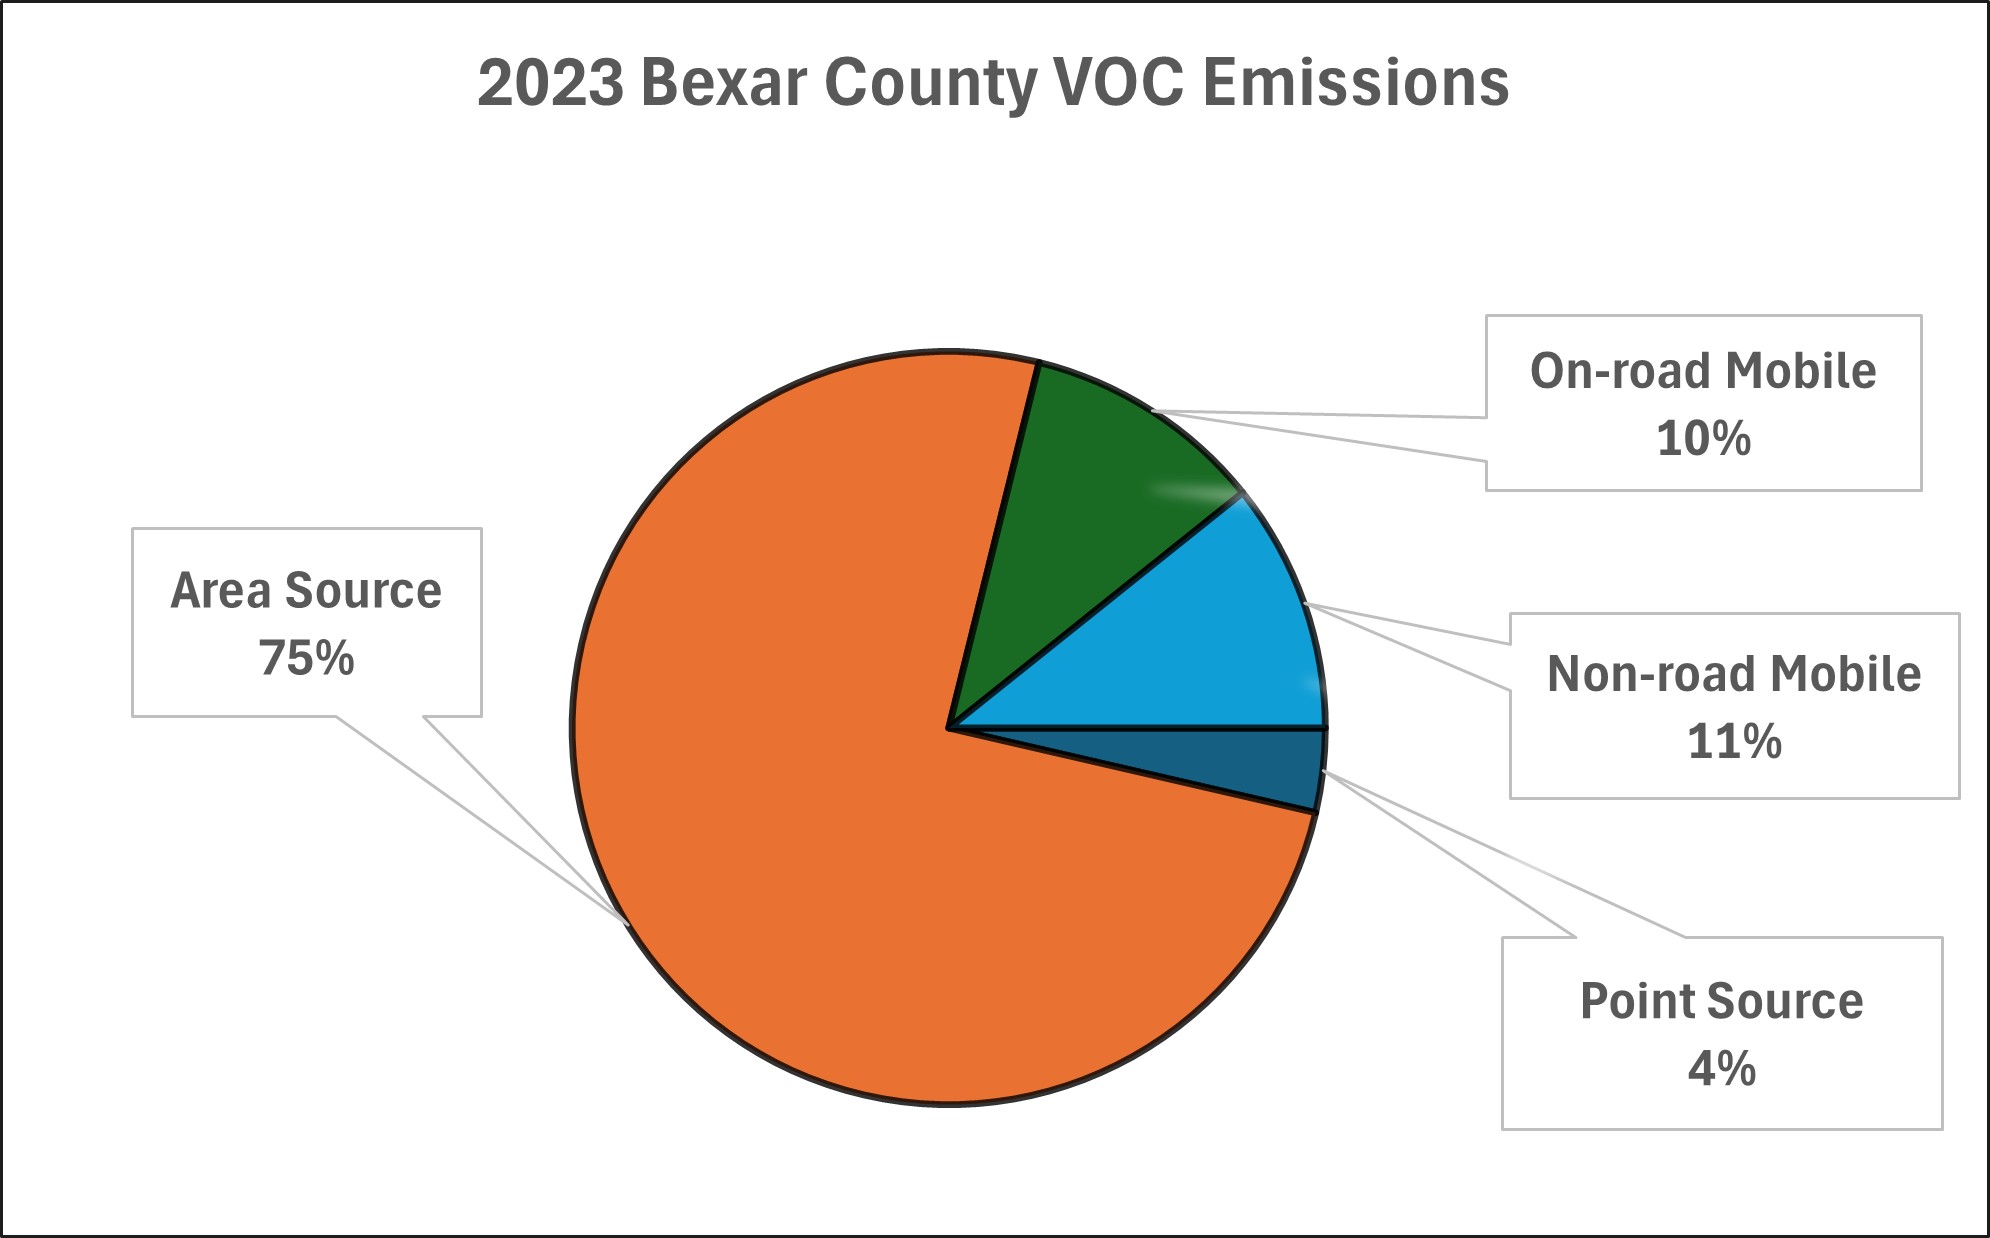
San Antonio VOC Emissions and Sources

This chart represents calendar year 2020 volatile organic compound emissions for the Bexar County San Antonio area. 77 percent of emissions are from area sources, 20 percent of emissions are from mobile sources, and 3 percent of emissions are from point sources