Daily Summary Report By Site
The TCEQ now offers continuous ambient monitoring data from stations located in multiple states.
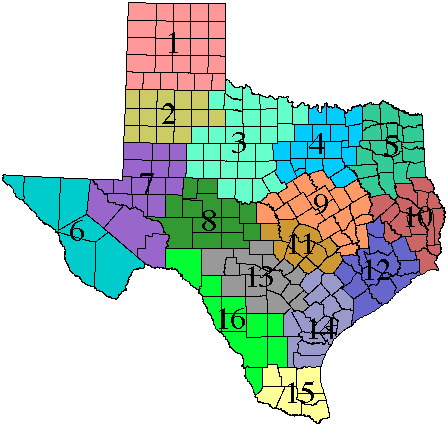
Select a region from the map below to retrieve a daily summary of hourly data collected at TCEQ's (and other select monitoring entities) continuous ambient monitoring stations. These monitoring stations continuously sample the atmosphere and create an average every five minutes for each parameter monitored. Hourly averages are then calculated from these five-minute averages.
|
|
Although this is the most current data, it is not considered official until it has been certified by the TCEQ (or other responsible entity) technical staff. This web page does not present data from all TCEQ continuous ambient monitoring stations prior to June 1998 or from other monitoring entities before January 2000. Data from all TCEQ continuous ambient monitoring stations is available through this web page for dates after June 1998. Only data from monitoring entities that are partnered with the TCEQ is available via this web page. This information is updated hourly.
This web page provides the most current hourly averaged data available. Our convention for time-tagging data is the beginning of each hour. For example, values shown for the noon hour are based on measurements taken from noon to 1:00 p.m. The noon average will not be calculated until after 1:00 p.m. The noon average will then be available on our external server from 1:15 p.m. to 1:30 p.m. This results in an apparent one-hour time lag in the data. We also present our data in Local Standard Time for each measuring site. For most of Texas this is Central Standard Time. During Daylight Savings, this introduces another apparent one-hour time lag in the data.
PLEASE NOTE: This data has not been verified by the TCEQ and may change. This is the most current data, but it is not official until it has been certified by our technical staff. Data is collected from TCEQ ambient monitoring sites and may include data collected by other outside agencies. This data is updated hourly. All times shown are in local standard time unless otherwise indicated.
Following EPA reporting guidelines, negative values may be displayed in our hourly criteria air quality data, down to the negative of the EPA listed Method Detection Limit (MDL) for the particular instrument that made the measurements. The reported concentrations can be negative due to zero drift in the electronic instrument output, data logger channel, or calibration adjustments to the data. Prior to 1/1/2013, slightly negative values were automatically set to zero.