Volatile Organic Compound Data
TCEQ monitors near real-time volatile organic compound (VOC) concentrations using Automated Gas Chromatographs (AutoGCs). Access the VOC data, monitoring site details, maps and images. Learn how AutoGCs work and their limitations.
What, why, and their limitations.
Ozone precursors
VOCs along with oxides of nitrogen, and solar (UV) radiation are key components in ozone formation. Individual VOCs can vary greatly in concentration and their reactivity (i.e., potential to form ozone).
A key component in studying the dynamics of ozone formation in a given geographic area is the determination of the spatial and temporal variability, composition, and concentration of these individual VOCs. These data can then be used to help target control strategies to minimize ozone formation, especially if VOCs are determined to be the limiting factor in ozone formation reactions. TCEQ operates Photochemical Assessment Monitoring Stations (PAMS) as a partner in this national monitoring effort.
Air Toxics
There are currently 188 hazardous air pollutants (HAPS) , or air toxics, regulated under the Clean Air Act (CAA) that have been associated with a wide variety of adverse health effects. A subset of the 188 toxics thought to have the greatest impact on the public and the environment in urban areas has been identified as the Urban Air Toxics Strategy compounds of interest. This subset of 33 compounds includes volatile organics, semivolatile organics, and metals.
Two of the six compounds identified as the risk drivers in the strategy, benzene and
1,3-butadiene, are
volatile organics which are amenable to AutoGC analysis. Data for these two target compounds, as
well as all
other target compounds from this analysis, are reviewed by the TCEQ Toxicology Division to
identify any
potential health impacts that might be associated with exposure to the measured
concentrations.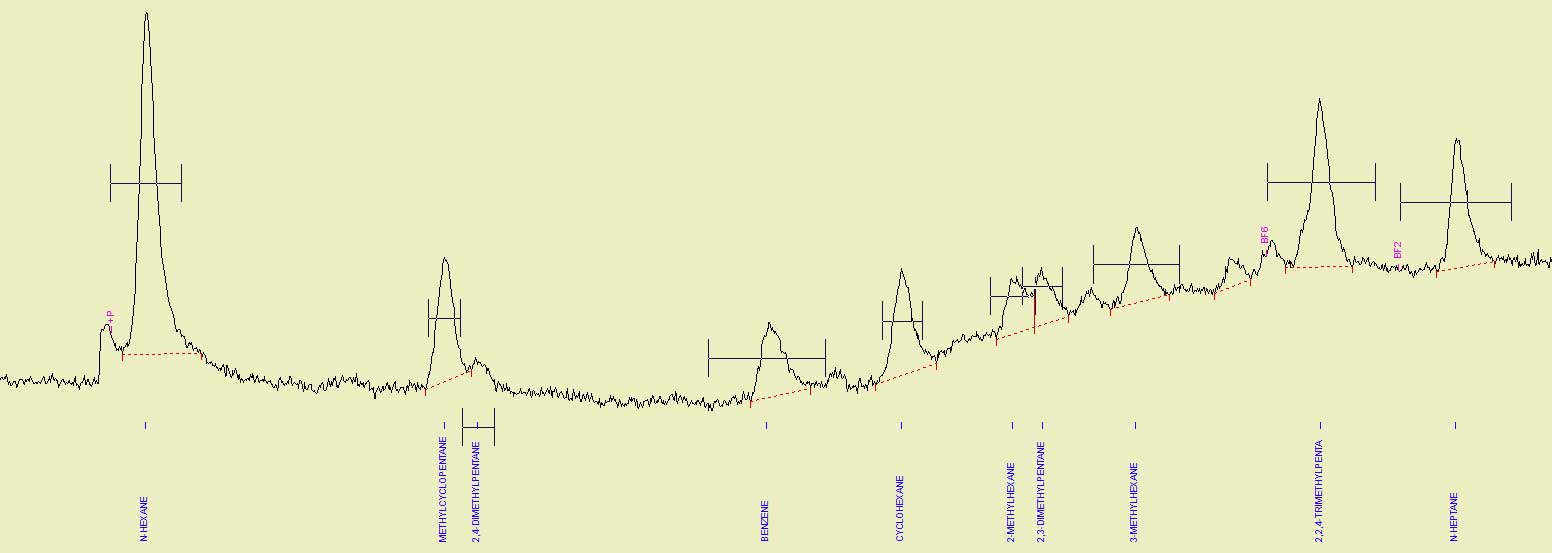
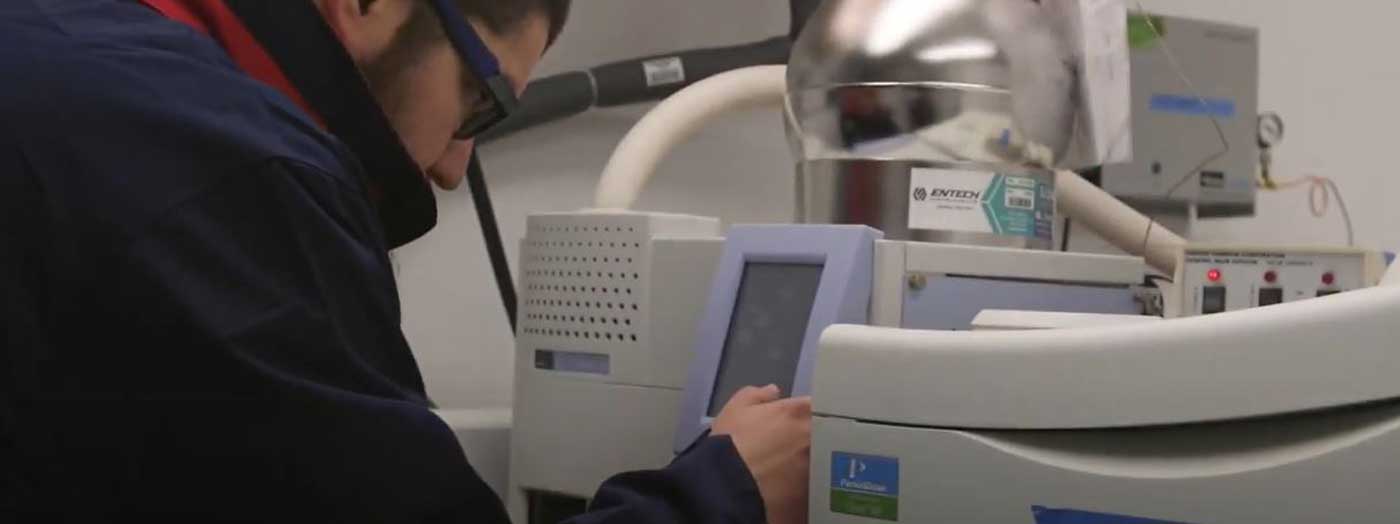
Automated Gas Chromatographs
AutoGC analysis can measure ambient levels of a number of VOCs which are of interest from an ozone formation standpoint even when their concentrations are too low to cause direct health effects. These VOCs include the highly reactive VOCs (HRVOCs) that TCEQ has identified as major contributors to ozone formation in the Houston area. These HRVOCs are: ethylene, propylene, 1,3-butadiene, and butenes (c-2-butene, t-2-butene, and 1-butene). These data are made available to TCEQ modelers, policy makers, EPA, local industries and the public.
Limitations
AutoGCs are designed to collect data at a given sampling location over time. These instruments can be configured to automatically provide speciation data for 1 to over 55 targeted VOCs. However, the more extensive the list of compounds the more difficult it becomes to ensure that any single compound is correctly identified and quantitated at the time of initial data capture. Changes to compound identification and concentration are not uncommon during this validation process. Therefore, it is vital that the data user is aware of the high degree of uncertainty in the unvalidated data and any actions or decisions based on unvalidated data should be made with this in mind.
Links to air toxics data collected by TCEQ's AutoGCs, a description of why this data is collected and how it is used, and monitoring network and program contact information.
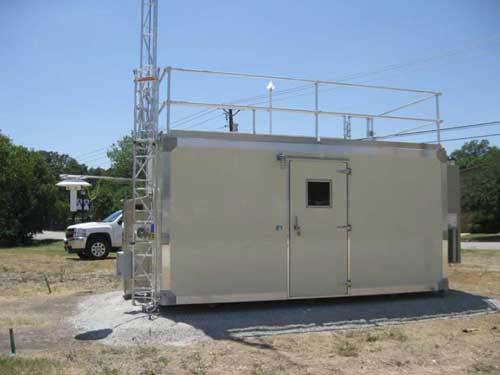
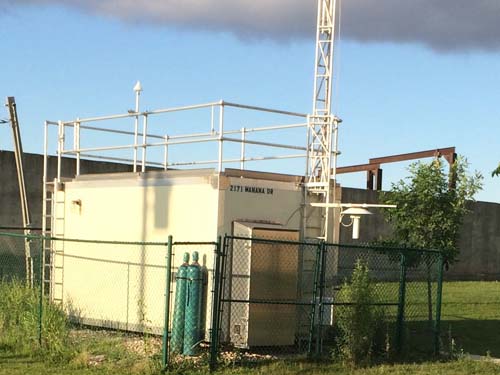
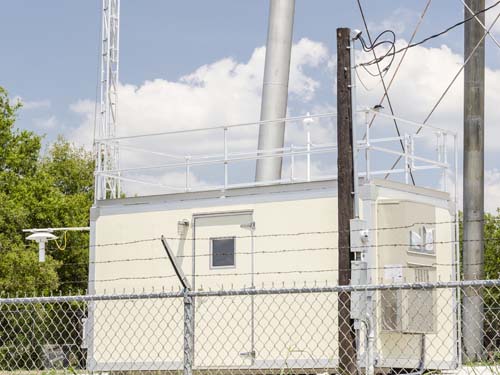
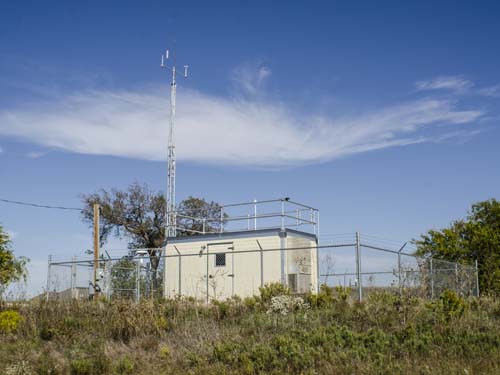
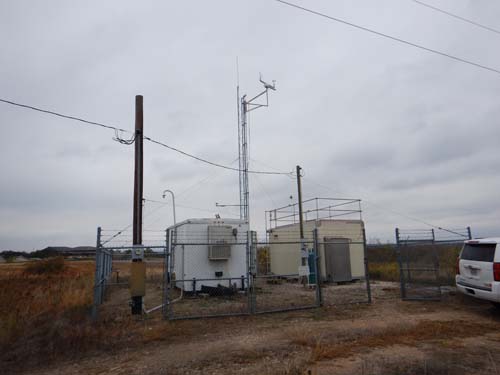
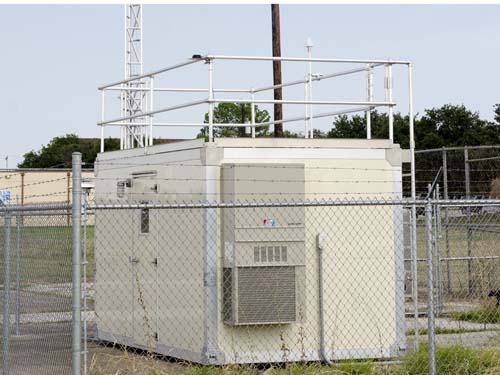
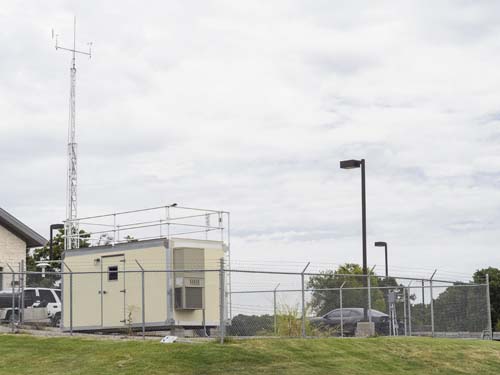
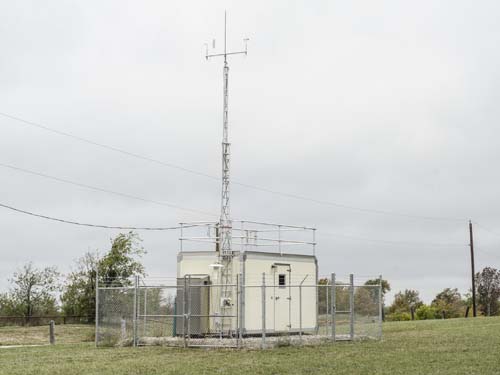
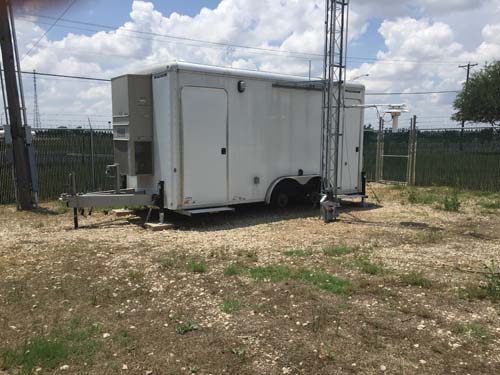
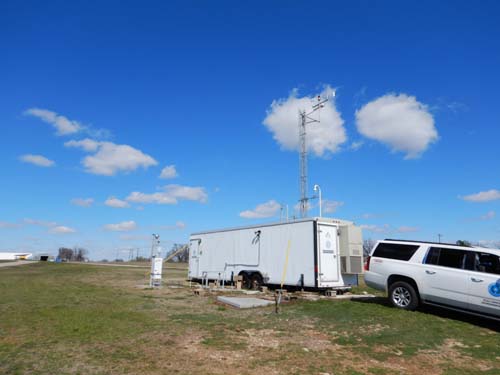
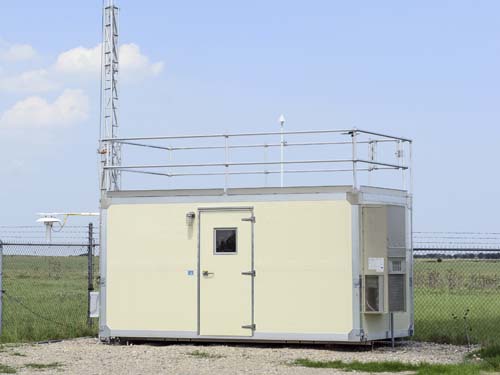
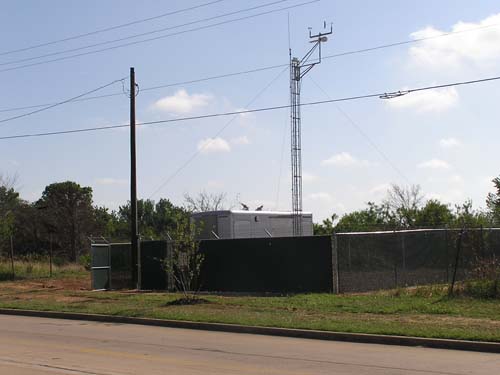
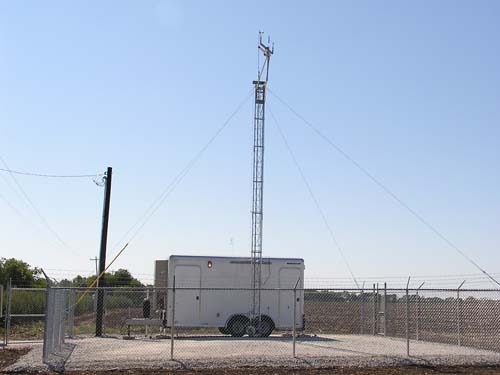
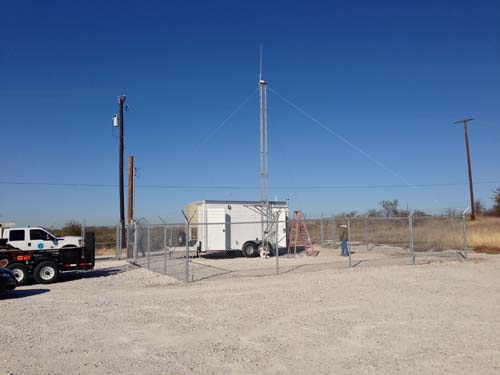
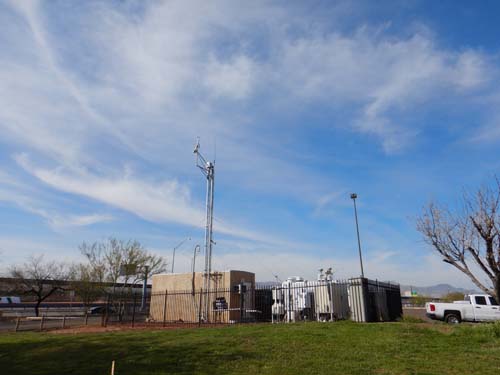
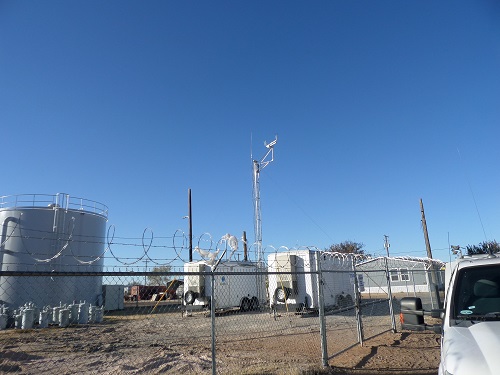
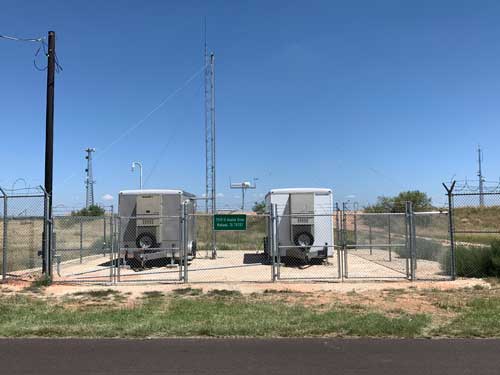
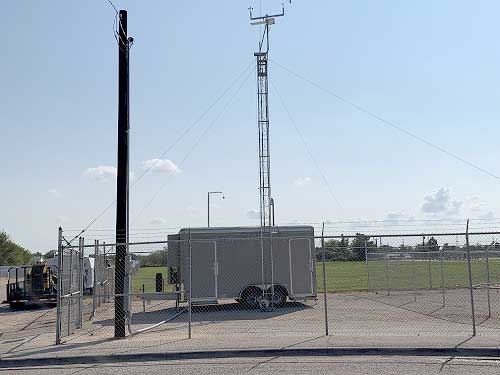
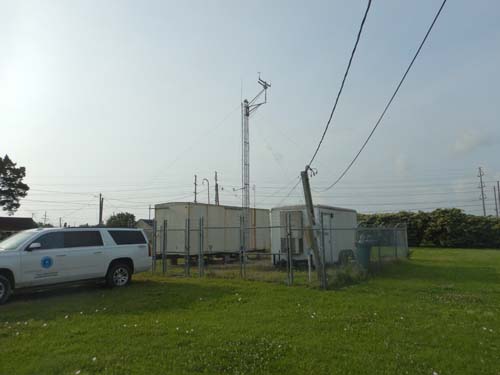
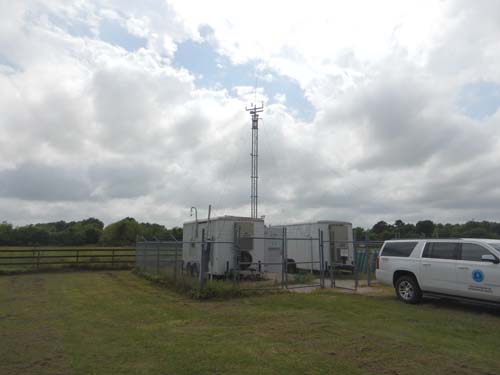
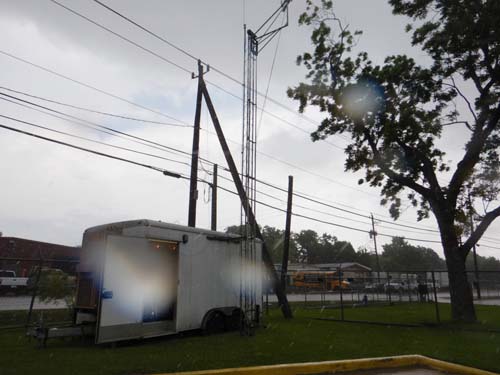
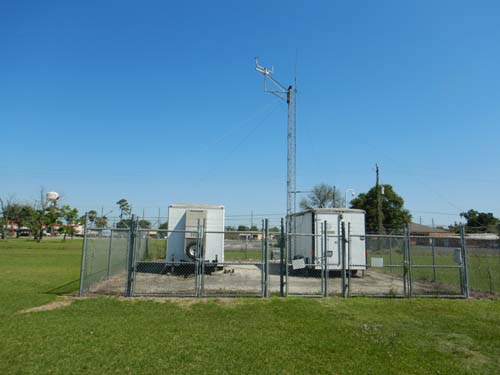
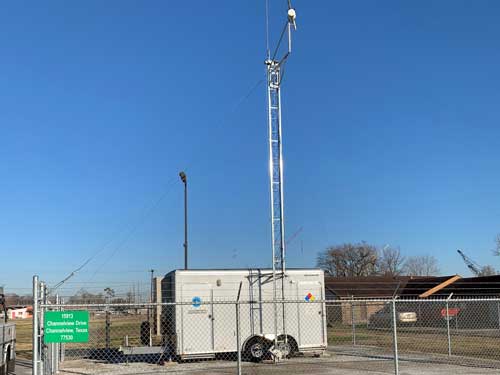
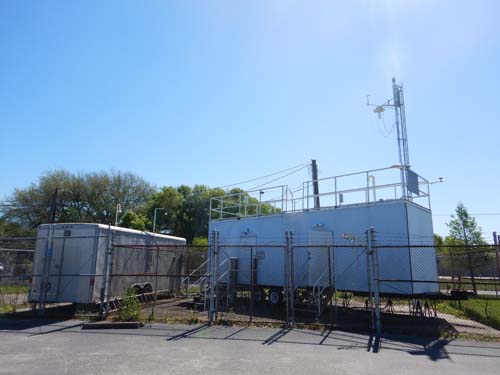
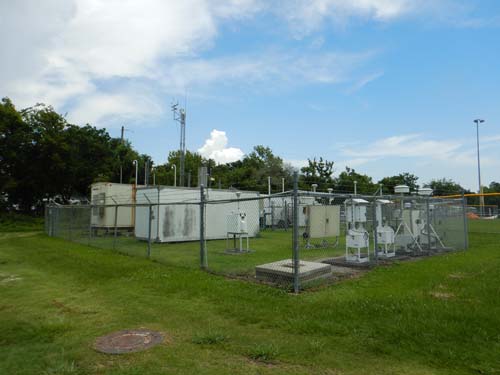
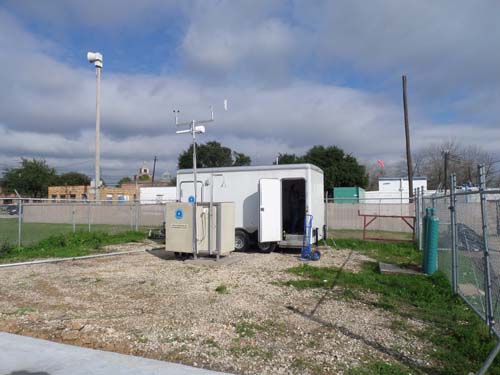
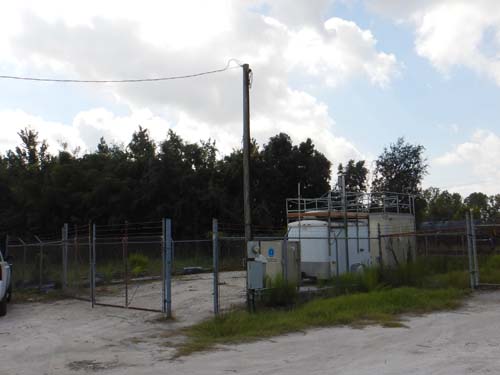
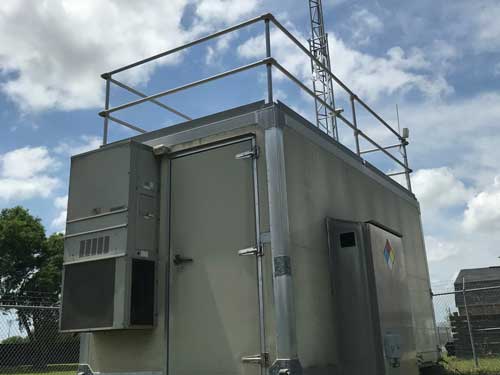
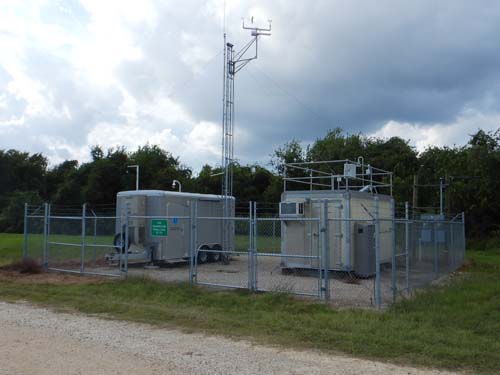
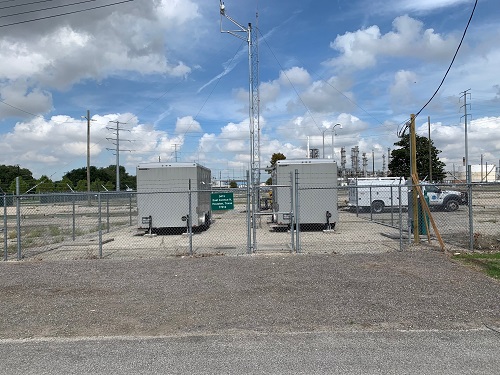
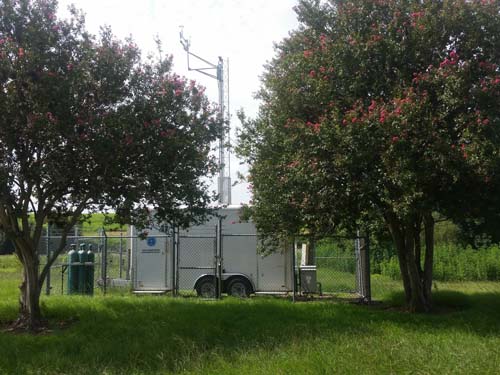
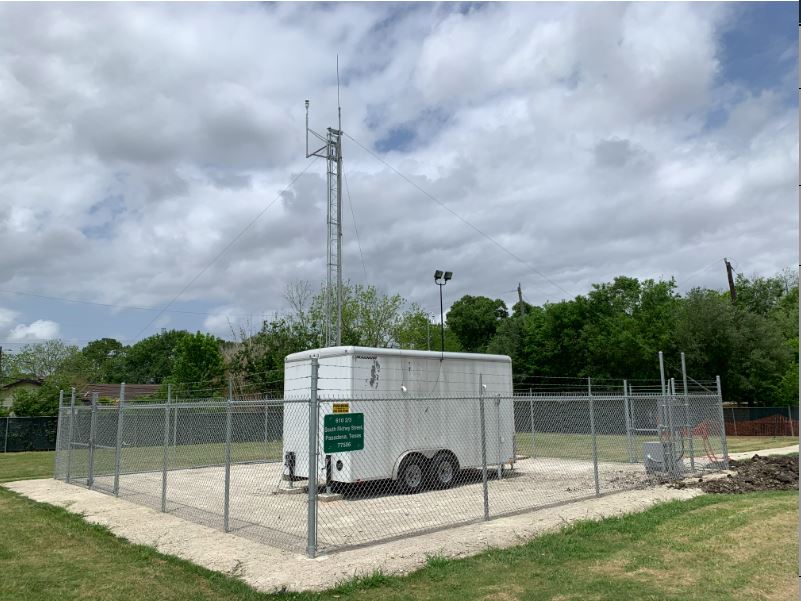
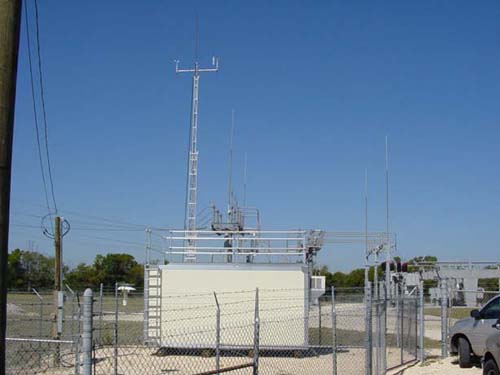
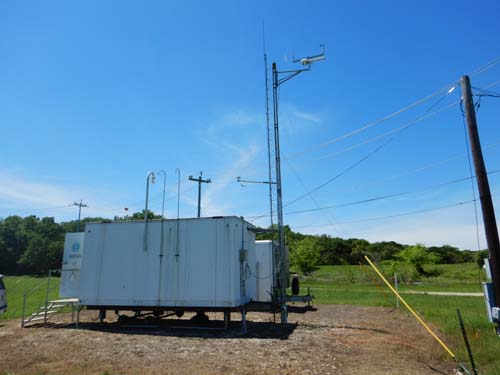
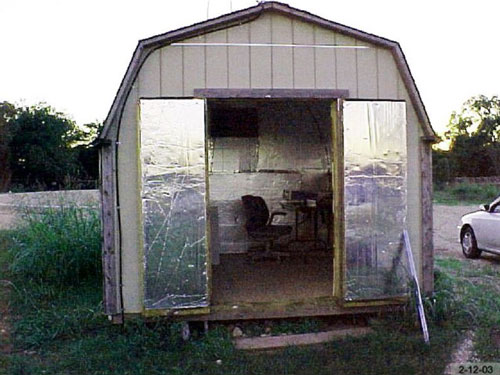
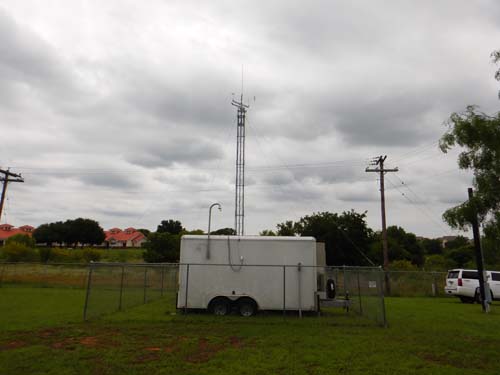
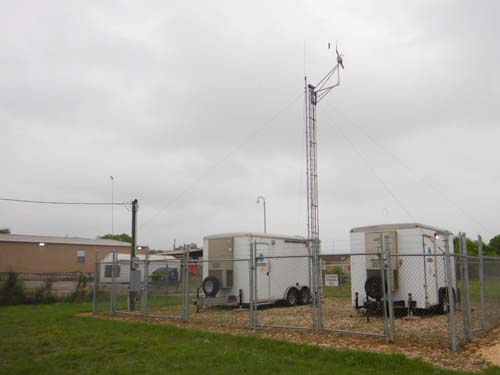
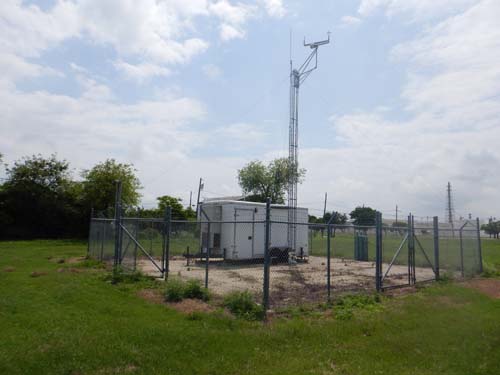
Automated Gas Chromatographs' (AutoGCs) monitoring stations, data, locations, and photos of monitoring sites. The interactive map links to air toxics data, why this data is collected and how it is used, and monitoring network and program contact information.
- Mouse over the colored areas of the map to see what region is represented by that selection.
- Click on a region to see available data collected from that particular region.
- Brown areas on the map are regions for which no data are available.
Dallas / Fort Worth — TCEQ Region 4
El Paso — TCEQ Region 6
Midland — TCEQ Region 7
Beaumont — TCEQ Region 10
Houston — TCEQ Region 12
San Antonio — TCEQ Region 13
Corpus Christi — TCEQ Region 14
Specifically concerning monitors in the city of Dish and the Eagle Mountain Lake area
In working to ensure that TCEQ’s ambient monitoring network is performing properly, the agency will routinely conduct performance evaluations of the monitors throughout a calendar year. These performance evaluations normally follow a prescribed Quality Assurance Project Plan, which details the quality assurance procedures, quality control activities, and other technical activities that are implemented for a specific program. In general, the agency will conduct these performance evaluations twice a year for each of its AutoGC monitors. Additionally, if there are contractors operating the AutoGC monitors for the TCEQ, the agency may request that the contractors conduct a separate performance evaluation of the monitors. Both the agency’s and the contractor’s evaluations consist of introducing control samples that contain a variety of compounds prepared from known chemical standards. As part of the performance evaluation, the standards are different from the standards used to calibrate the monitors on a daily basis. The results from the performance evaluation are then used to identify any potential instrument, operation, or validation issues.
In April 2010, two new AutoGC monitors started collecting sampling data, one in the city of Dish and the other in the area of Eagle Mountain Lake. TCEQ conducted a statewide performance evaluation beginning in May 2010 that included the Dish and Eagle Mountain Lake monitors for the first time.
Summary of Internal Audit of TCEQ Automated Gas Chromatograph (AutoGC) Monitors
Since the University of Texas Center for Energy and Environmental Resources (CEER) has contracted with the agency to operate the DISH and Eagle Mountain Lake AutoGC monitors, CEER, along with its subcontractor, was requested to conduct an independent performance evaluation of the two monitors.
Finally, the U.S. Environmental Protection Agency (EPA) conducted a technical systems analysis of the TCEQ’s Air Monitoring Program during the month of September 2010. As part of this TSA visit, the EPA also conducted an audit of the DISH AutoGC monitoring station.
Contact Information
- Health impacts - Toxicology Section - tox@tceq.texas.gov
- Measurement technology - Monitoring Division- monops@tceq.texas.gov
- Data availability/problems/validation or errors - Monitoring Division - monops@tceq.texas.gov
- Requests for additional monitoring data - Monitoring Division - monops@tceq.texas.gov
- Ozone precursors - Air Quality Planning- aqp@tceq.texas.gov
- Report an environmental problem