Skip to Content
Questions or Comments: info@tceq.texas.gov

Air Monitoring

The latest forecast for air quality conditions in Texas' metropolitan areas.

Air Quality and Monitoring

Featuring the latest information regarding the Texas air monitoring network, monitoring data, and air quality forecast conditions for Texas' metropolitan areas.

Ambient Air Monitoring

Texas has one of the most robust air monitoring networks in the country consisting of over 200 monitoring stations serving over 25 million Texans statewide in areas where the presence of industry intersects with large segments of the state’s population. This network assists TCEQ in monitoring compliance with federal air quality standards, providing information in response to localized air quality concerns, evaluating air pollution trends, and studying air pollution formation and behavior. TCEQ monitoring network includes more than double the number of monitors required by federal rule, in addition to numerous state-initiative monitors.

The Federal Clean Air Act provides for establishing national ambient air quality standards (NAAQS) for six commonly occurring air pollutants, or “criteria pollutants”, that can be harmful to public health and the environment.

TCEQ monitors ambient air concentrations of these and other pollutants at stationary monitoring sites across the state. Near real-time monitoring data can be found using the links in the right and left menus.

TCEQ also maintains the Texas Air Monitoring Information System (TAMIS) that allows users to generate and download ambient air quality data collected at these monitoring stations.

GeoTAM
Interactive Monitoring Map (GeoTAM)

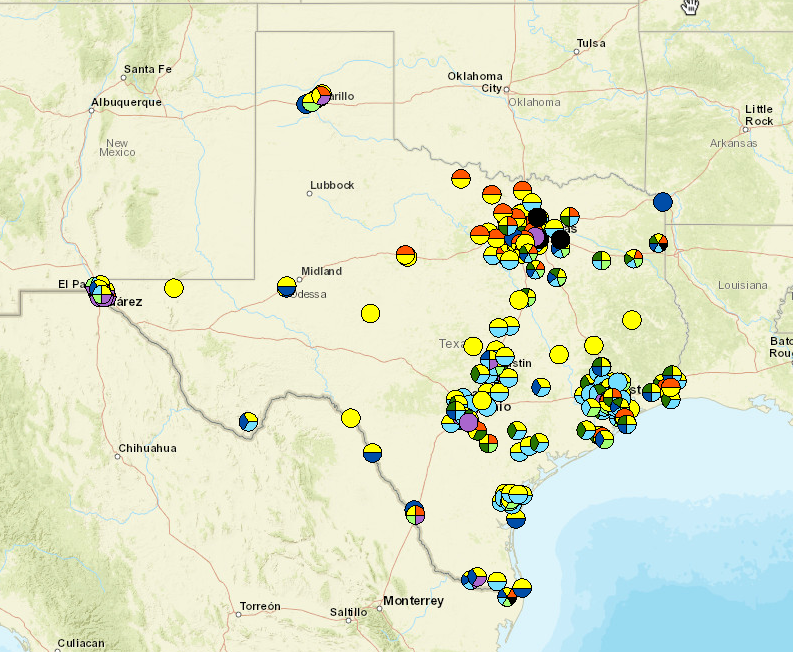
The GeoTAM Dashboard presents users a geospatial way to view the current live ambient air values. These measurements are collected at ambient air monitoring sites owned by the Texas Commission on Environmental Quality (TCEQ) and hosted monitoring partners. The pollutants displayed include ozone (O3), sulfur dioxide (SO2), particulate matter of 2.5 micrometers or less in diameter (PM2.5), benzene, toluene, styrene, and 1,3-butadiene, if the pollutant is measured at the air monitoring site. Individual air monitoring sites may also collect several other pollutants.

GeoTAM Dashboard

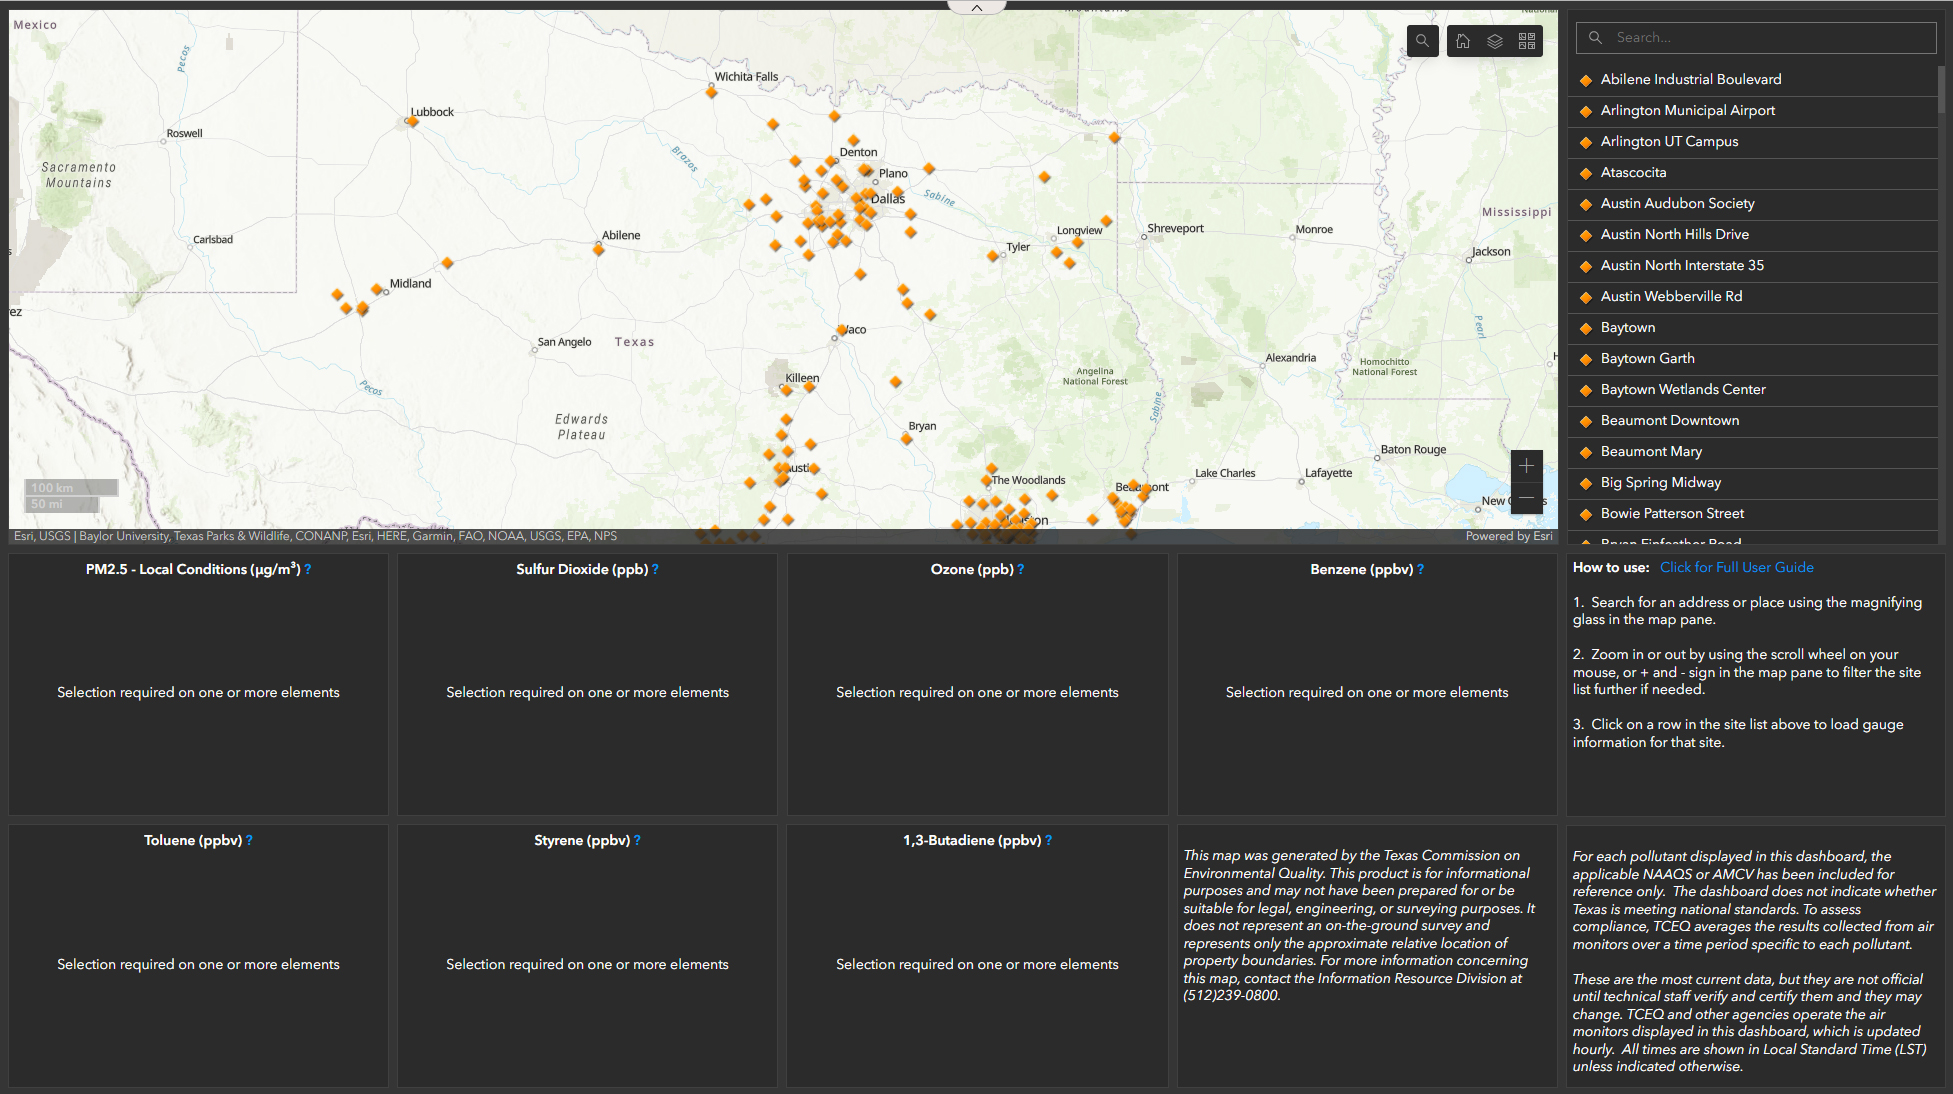
In addition to the six criteria pollutants, TCEQ’s monitoring network also measures a variety of air toxics that include hydrogen sulfide, volatile organic compounds, metals, and carbonyls. The specific pollutants measured at each monitoring station can be identified using the GeoTAM viewer.

Placement of air monitors is determined consistent with federal air monitoring rules using population trends, reported emissions inventory data, local meteorological data, and, if available, existing air monitoring data for a given area. In addition, TCEQ may prioritize monitor placement in areas with potential air quality issues, or to address local air quality concerns. TCEQ strives to strategically balance meeting federal monitoring requirements and state and local needs with available funding and staffing resources.

Each specific monitor location must meet strict siting criteria that include minimum spacing from trees or other obstructions, free of influences from specific sources, and logistical considerations, such as available space, power, and level terrain. Final site selection is contingent on TCEQ receiving proper access authorization from property owners for properties that meet these siting criteria.

TCEQ uses a variety of measures to ensure its air monitoring data is of the utmost quality. Air monitors are assessed daily to verify their operations remain within proper specifications. TCEQ personnel physically visit each monitoring station on a weekly basis to conduct various quality control checks and preventive maintenance activities. The monitoring instruments themselves must meet rigorous sampling and analytical requirements prescribed by federal air monitoring rules and undergo daily, weekly, and quarterly quality control checks to verify the instrument’s calibration, accuracy, and precision. In addition, independently calibrated instruments are used to perform quarterly and annual audits of the air monitors and their operation.

Finally, a validation assessment is performed on all data to verify TCEQ’s data quality objectives are met. The data are reviewed for outliers, regional comparability, quality assurance/quality control requirements, and other data quality assessment indicators. Data that do not meet these objectives completely are invalidated or denoted accordingly.

TCEQ air monitoring network is designed to measure pollutant concentrations for assessing regional air quality representative of areas frequented by the public. Monitors can measure the impact on air quality from industrial sources present in an area, but do not measure the emissions from individual sources or determine a source’s compliance with permitted emission limits. Data from the ambient air monitoring network is used to determine compliance with the national ambient air quality standards (NAAQS), evaluate pollutant trends, forecast daily air quality conditions, perform air quality and human health impact studies, and inform regulatory decisions. Finally, while stationary air monitors may provide useful data during disasters or emergency events, they are not specifically intended for those purposes.

TCEQ monitors air pollution levels across the state - by Chikage Windler CBS Austinair-laboratory.jpg

TCEQ Air Quality Forecasting

TCEQ Ozone Action Day Forecasting

TCEQ Stationary Air Quality Monitoring

Take This Job: Testing the Air Quality in Austin | KVUE

KXAN Meteorologist Kristen Currie Interviews Cory Chism on Air Monitoring in Texas

Kristen Currie Interviews Neal Penney on Particulate Matter

Kristen Currie Interviews Neal Penney on Air Monitoring Instruments

Saharan Dust Q&A with TCEQ Meteorologist Weslee Copeland

Important:
Timeline for Near Real-time Ambient Air Quality Data: The time it takes for near real-time monitoring data to reach our webpages. TCEQ strives to bring you the latest monitoring information data as quickly as possible, The data that we collect is displayed in local standard time (LST) as per EPA standards.

Envelope icon for e-mail sign up Air Quality Forecast and Ozone Action Day Alerts (sign up to receive email or text alerts for several metropolitan areas throughout Texas)

Related Content

Modeling and Studies

For questions about the following studies, please contact the Air Quality Division.

  • Air Quality Modeling: An introduction to air quality modeling, with links to data files and related research.
  • Air Quality Research: Links to projects and programs designed to improve the state of air quality science and policy.

Air Pollutant Watch List and Toxicology

The APWL includes cities or counties that have elevated concentrations of air pollutants. TCEQ’s Toxicology program oversees the APWL.

Air Quality Forecast and Ozone Action Day Alerts

Sign up to receive the Today's Texas Air Quality Forecast and/or Ozone Action Day email or text alerts for several metropolitan areas throughout Texas.

The Today's Texas Air Quality Forecast is based on the EPA's Air Quality Index scale for ozone, PM2.5, and PM10, made for 14 forecast regions across the state (Austin, Beaumont-Port Arthur, Brownsville-McAllen, Corpus Christi, Dallas-Fort Worth, El Paso, Houston, Laredo, Lubbock, Midland-Odessa, San Antonio, Tyler-Longview, Victoria, and Waco-Killeen). It is updated daily on normal TCEQ work days and may also be updated on weekends or holidays when air pollution levels are high. The forecast is posted on the Today's Texas Air Quality Forecast webpage and disseminated via e-mail whenever updates are made.

Each day during ozone season (roughly March through November in Texas), Ozone Action Day forecasts are made for nine participating metropolitan areas (Austin, Beaumont-Port Arthur, Corpus Christi, Dallas-Fort Worth, El Paso, Houston, San Antonio, Tyler-Longview, and Victoria). TCEQ informs the public typically a day in advance when conditions are forecast to be favorable for high ozone levels in any of the participating areas so citizens, businesses, and industry can take steps to reduce the pollutants that contribute to ozone formation. For more information on the Ozone Action Day forecast program, a list of the individual areas' official ozone season dates, and ozone in general, see Ozone: The Facts.

Auto GCs

Information about Auto GCs in the state of Texas.

TCEQ monitors near real-time volatile organic compound (VOC) concentrations using Automated Gas Chromatographs (AutoGCs). Access the VOC data, monitoring site details, maps and images. Learn how AutoGCs work and their limitations.

AQI and Data Reports

Air quality index reports, airborne particulates, ozone, and meteorological and climatological data.

Air Quality Index (AQI)

The AQI scale is divided into the following categories:

AQI Air Quality Scale

Each National Ambient Air Quality Standards (NAAQS ) pollutant has a separate AQI scale, with an AQI rating of 100 corresponding to the concentration where health effects for each pollutant begin to affect the general public. AQI ratings below 100 indicate no appreciable health risk. Additional information about the AQI and how it can be used is available from the EPA .

The AQI for ozone is based on the either the peak eight-hour running average since midnight OR the peak one-hour measurement since midnight. The AQIs for PM-10 and PM-2.5 are based on a 24-hour average sampled from midnight to midnight. The AQI for carbon monoxide is based on the peak eight-hour running average since midnight. The AQI for sulfur dioxide is based on the either the peak one-hour measurement since midnight OR the peak 24-hour average sampled since midnight. On most days the critical pollutant is ozone. Ozone one-hour average concentrations of 125 ppb or higher exceed the old NAAQS. The new NAAQS for ozone is based on eight-hour averages; an eight-hour average of 71 ppb exceeds the new NAAQS for ozone.

Ozone Reports

Ozone: The Facts
Sound science and targeted regulations have greatly reduced ozone concentrations in Texas cities and across the nation.

Voluntary Steps in Helping Prevent Ozone
These simple tips will help you save money while protecting the Texas environment.

Houston

Texas Cities' Compliance with Eight-Hour Ozone Standard
Report for the fourth highest daily maximum eight-hour average ozone concentrations in Texas Metropolitan areas.


Daily Maximum Eight-Hour Ozone Averages
Maximum eight-hour ozone averages measured daily from yesterday back to 1997.


Four Highest Eight-Hour Ozone Concentrations
Calculated from TCEQ monitoring site data available from today back to 1997.


Eight-Hour Ozone High Value Days
Averages that meet or exceed 85 parts per billion ozone. Data available from one hour ago back to 1997.

Ozone Hourly Averages

Click a region to get a list of hourly averages.

tceq regions region 1 region 2 region 6 region 7 region 3 region 4 region 5 region 8 region 9 region 10 region 11 region 16 region 13 region 15 region 14 region 12

PLEASE NOTE: This data has not been verified by TCEQ and may change. This is the most current data, but it is not official until it has been certified by our technical staff. Data is collected from TCEQ ambient monitoring sites and may include data collected by other outside agencies. This data is updated hourly. All times shown are in local standard time unless otherwise indicated.


High One-Hour Ozone Values
Measurements of high one-hour ozone concentrations.


High Ozone Summary
Table that summarizes high one-hour averages greater than 125 ppb and eight-hour ozone averages greater than 76 ppb in Texas metropolitan areas.


Peak Daily One-Hour Ozone Averages
Maximum one-hour ozone averages measured daily from yesterday back to 1996.

Airborne Particulates

Shows how much smaller pm2.5 is than human hair or sand

Airborne particulates (example: dust, smoke, respiratory droplets containing viruses or bacteria) are also referred to as particulate matter or PM. Some are large enough to be seen with the naked eye, while others are so small they can only be seen with a microscope. These can come from natural sources like pollen, dust and wildfires; or from human activity, such as vehicle emissions and some industrial processes. These particles can be classified according to their size and their chemical composition, such as PM2.5 (particles 2.5 microns or less in size or PM10 (particles 10 microns or less in size).


View Airborne Particulates tables

Tables summarizing the measured averages of fine particulates (particles 2.5 microns or less in size) and coarse particulates (particles 10 microns or less in size) from the air in Texas metropolitan areas.


PM2.5 (particulate matter) are fine particles and are the smallest particles that are regulated. They consist of particles that are less than or equal to 2.5 micrometers in diameter. By comparison, the average diameter of human hair is 70 micrometers.

As they are so small, PM2.5 can easily travel through your respiratory tract into your lungs and your bloodstream, where they can cause various health problems. Health effects of high concentrations can include: irregular heartbeat, aggravated asthma, decreased lung function, respiratory problems, nonfatal heart attacks, and premature death in people with heart or lung disease. With knowledge of the level of air pollutants in your area, you are able to actively take steps to protect from the negative effects by limiting outdoor activity.


Current PM2.5 Hourly Averages by Region
TCEQ’s monitoring of particulate matter 2.5 micrometers or less in diameter, measured at each region.

Click a region to get a list of hourly averages.

TCEQ Regions region 1 region 2 region 6 region 7 region 3 region 4 region 5 region 8 region 9 region 10 region 11 region 16 region 13 region 15 region 14 region 12

Four Highest 24-Hour PM2.5 Concentrations
Retrieve the four highest 24-hour PM2.5 (local conditions) acceptable concentration averages from data collected at TCEQ monitoring sites beginning January 1, 1998 through today.

Daily, Monthly, and Yearly Data Reports

AQI Air Quality Dallas

Daily Hourly Data:

Hourly Data
Hourly averages for all the pollutants and meteorological conditions measured by the TCEQ at each monitoring site.

Map
Use our interactive map to find hourly averaged data.

Monthly Hourly Data:

Monthly Data
Monthly summaries of the hourly averages for all the pollutants and meteorological conditions measured by TCEQ at each monitoring site.

Map
Use our interactive map to find monthly averaged data.

Yearly Hourly Data:

Yearly Data
Yearly summaries of the hourly averages for all the pollutants and meteorological conditions measured by TCEQ at each monitoring site.

Map
Use our interactive map to find yearly averaged data.


Hourly Air Pollution Data by Pollutant
Search for measurements of particular air pollutants found at TCEQ monitoring sites statewide.


Daily Summary Report By Site
A daily summary of hourly data collected at TCEQ's (and other select monitoring entities) continuous ambient monitoring stations.


Monthly Summary Report By Site
A monthly summary of hourly data collected at TCEQ's (and other select monitoring entities) continuous ambient monitoring stations.

Meteorological and Climatological

Current measurements of winds in the lower atmosphere, which help determine the movement of air pollution across Texas. Wind measurements from these profilers are used to determine the transport of air pollution and to help validate model-generated wind fields used for air quality modeling.

These wind plots are currently unavailable due to technical issues and will be restored as soon as resolved

La Porte Current Wind Plot

Dallas-Fort Worth, Cleburne Airport Current Wind Plot

How It Works

The radar profilers transmit radio wave pulses into the atmosphere and then record the resulting backscattered radio waves to measure winds in the range from 137 meters (449 feet) to 3,601 meters (11,814 feet) above ground level.

Real-time wind data plots are generated every 30 minutes from the radar profilers and relayed to this Web site for display. The plots show the last 12 hours of wind profiles. The wind data are plotted in standard meteorological form, with a vector line indicating the wind direction and barbs indicating the wind speed. The barbs are plotted on the tail of the wind vector (the end where the wind is coming from). Each full barb indicates five meters per second of wind speed (about 10 knots or 12 miles per hour) and a half-barb indicates 2.5 meters per second (about five knots or six miles per hour). The wind plots are colorized for wind speed using the color scale shown on the right side of the plot.

National Oceanic and Atmospheric Administration (NOAA) Data

Data from TCEQ radar profilers are available from NOAA's Multi-Agency Profiler Graphical Data Displays .

Data from the EPA AIR DATA page

The AirData website gives you access to air quality data collected at outdoor monitors across the United States, Puerto Rico, and the U. S. Virgin Islands. The data comes primarily from the AQS (Air Quality System) database. You can choose from several ways of looking at the data:

  • download data into a file (or view it on the screen)
  • output the data into one of AirData’s standard reports
  • create graphical displays using one of the visualization tools
  • investigate monitor locations using an interactive map

AirData lets you display and download monitored hourly, daily, and annual concentration data, AQI data, and speciated particle pollution data.

Monitoring Sites

Information about TCEQ air monitoring sites.

Maps, tables, and photos of air quality monitoring sites, plus parameters and measurements.

Ozone: The Facts

Sound science and targeted regulations have greatly reduced ozone concentrations in Texas cities and across the nation.

What is ozone?

Ozone, sometimes referred to as smog, is a gas that is formed in the atmosphere when three atoms of oxygen combine. The chemical structure of ozone is the same wherever it is found; however, there are two categories of ozone.

Stratospheric Ozone is found naturally in the Earth’s upper atmosphere - 6 to 30 miles above the Earth’s surface - where it forms a protective layer that shields us from the sun’s harmful ultraviolet rays.

Ground-Level Ozone is found at ground level (it is also called tropospheric ozone). It is not emitted directly into the air, but created by chemical reactions between oxides of nitrogen (NOx) and volatile organic compounds (VOCs) in the presence of sunlight. Emissions from industrial facilities and electric utilities, motor vehicle exhaust, gasoline vapors, and chemical solvents are some of the major sources of NOx and VOCs. In addition, biogenic sources (living organisms or biological processes) release VOCs that can contribute to ground-level ozone.

What are the health effects of ground-level ozone?

Ground-level ozone is of particular importance because it is a respiratory toxic agent that can cause acute respiratory health effects when people breathe high concentrations of it over several hours. These effects include decreased lung function and pain with deep breaths, and aggravated asthma symptoms.

What conditions lead to elevated ground-level ozone concentrations?

Summer days in Texas can be conducive for ozone formation as high-pressure systems dominate our local weather patterns, giving us clear skies and stagnant winds. Ozone mainly forms in the highest concentrations on warm, sunny days with light wind speeds and low relative humidity which allows more of the pollutant to form and accumulate.

ozone

What about indoor air quality?

The United States Environmental Protection Agency (EPA) has identified and characterized significant risks to public health from indoor environmental contaminants that are commonly found in homes, schools, offices, and other buildings where, on average, Texans are spending about 90 percent or more of their time. It is possible for indoor levels of air pollutants to reach up to two to five times higher, and occasionally even 1,000 times higher, than outdoor levels—according to the Texas Department of State Health Services (DSHS).

Common indoor air contaminants include radon, tobacco smoke, cleaning products, chemicals in upholstery foam, mold, combustion by-products, and VOCs. Ozone is not typically an indoor air contaminant. However, ozone generators, which are sometimes used in homes as air purifiers, may cause harmful levels of ozone.

Building systems, such as heating, ventilating, and air conditioning, also have a direct influence on the type and amount of exposure occupants may experience from indoor environmental contaminants.

For more information on indoor air quality visit:

Should I limit exercise and stay indoors when ozone concentrations are elevated?

The World Health Organization ranks physical inactivity as a major risk factor for heart disease, breast cancer, colon cancer, and diabetes. The Centers for Disease Control and Prevention found that 27.2 percent of adults and 16.6 percent of youth in Texas were inactive in 2014. For children, the risks of obesity are well-documented.

Many people engage in physical exercise to prevent disease and obesity. Individuals must consider those benefits when making choices about whether to follow the EPA’s recommendation to limit exercise outdoors and stay indoors when concentrations of ozone in ambient air are elevated.

A personal decision to limit outdoor activities should consider more than ozone levels because there are other conditions that can increase health risks, such as high heat and humidity.

For more information on obesity risks, visit:

What is background ozone and why is it important?

Background ozone is the amount of ozone due to distant sources. It can come from natural processes such as movement from the stratosphere or wildfires. Also, it can be transported from international pollution sources. It is important to study the locations in which background ozone is formed and where that ozone is transported. This information is used to develop successful reduction strategies.

What is the Air Quality Index?

The AQI is a numerical scale accompanied by corresponding colors created by the EPA for rating air quality. The AQI scale is based on the National Ambient Air Quality Standards (NAAQS) and is used to report current conditions and forecast future conditions.

Each NAAQS pollutant, such as ozone, has a separate AQI scale. For a given locality, a pollutant other than ozone could be in the good range while the ozone level is unhealthy. Colors indicate the amount of threat to health posed by the concentration of a pollutant. For example, an AQI for a locality anywhere from 101 to 150 due to ozone is coded Level Orange, which means “unhealthy for sensitive groups.”

For more information on the AQI visit:

What is an Ozone Action Day forecast?

Ozone Action Day (OAD) forecasts are made daily by TCEQ meteorologists during the ozone-forecast season (roughly March through November in Texas) for each of nine metropolitan areas in Texas (see below).

Metropolitan Area

Ozone Forecast Season Begins

Ozone Forecast Season Ends

Austin

Beaumont-Port Arthur

Corpus Christi

Dallas-Fort Worth

El Paso

Houston

San Antonio

Tyler-Longview

Victoria

April 1

May 1

April 1

March 1

May 1

March 1

April 1

May 1

April 1

October 31

October 31

October 31

October 31

October 31

November 30

October 31

September 30

October 31

The OAD forecast seasons are based on when each area is likely to experience warmer temperatures and weather conditions that are favorable for increased ozone formation. Each forecast predicts whether ozone levels in the area may reach or exceed the EPA's Air Quality Index (AQI) Level Orange category (Unhealthy for Sensitive Groups). Level Orange on the AQI corresponds to a level of ozone that would exceed the level of the National Ambient Air Quality Standard (NAAQS).

TCEQ meteorologists use historic meteorological data, historic ozone measurements, and ozone-prediction models to make these predictions, which are forecasts and not actual measured ozone values. TCEQ issues OAD notifications a day in advance of when conditions are forecast to be favorable for the creation of elevated ozone levels so citizens, businesses, and industry can take steps to reduce the pollutants that contribute to ozone formation. When they forecast an OAD, TCEQ meteorologists contact the National Weather Service, which then broadcasts the information across its “weather wire.” TCEQ also contacts officials in affected areas so that local community clean-air coalitions can notify media, government, business, and industry. The forecasts are made, in most cases, by 2 p.m. local time and are valid for the next day.

TCEQ maintains records of when Ozone Action Days (OAD) are issued for each metropolitan area and has this information available going back to 2008. View Historical Ozone Action Days.

What can I do to limit ozone formation?

  • Limit driving and idling; instead, carpool, combine errands, use public transportation, bike, or walk.
  • Refuel your vehicle in the late afternoon or evening and don’t top off the tank.
  • Keep your vehicle maintained, including proper tire pressure.
  • Maintain your yard equipment, including changing the oil and replacing air filters regularly. Also consider using tools without motors. Hand tools such as shears, edgers, and push reel mowers are lightweight, quiet, and easy to use, and do not generate emissions.
  • Don’t burn yard waste.
  • Use paint and cleaning products with less or zero VOCs.

How can I sign up to receive email and text alerts?

You can subscribe for email and text alerts about tTCEQ’s Air Quality Forecast and other topics. Don’t worry, you can unsubscribe at any time.

You can also sign up to receive e-mail alerts through the EPA EnviroFlash website

Related Web Pages

Exceptional Event Demonstrations for Particulate Matter

Demonstrations supporting the proposed exceptional events for particulate matter data.

About Exceptional Events

Definition

Exceptional events are unusual or naturally occurring events that affect air quality and are not reasonably controllable or preventable. Wildfires are an example.

How They Affect Monitoring Data

States can request that the United States Environmental Protection Agency (EPA) exclude air quality monitoring data affected by an exceptional event from determining if an area met an air quality health standard . The demonstration documents below were developed in support of TCEQ's proposed exceptional event flags.

EPA Regulations and Guidance

Exceptional event regulations and guidance are provided on EPA's Treatment of Air Quality Monitoring Data Influenced by Exceptional Events website.

Current Exceptional Event Demonstration Proposal

El Paso, Nueces, and Harris County PM10 Demonstration for Three Days in 2021

Public Comment Period: Closed

TCEQ posted this demonstration for written public comment on Jun. 27, 2023. We will submit all comments received or postmarked by 5:00 p.m. CDT on Jul. 31, 2023, to the EPA along with the final demonstration. No public hearing will be held for this action.

Previous Exceptional Event Demonstrations

El Paso Demonstrations

December 23, 2020 PM10 Exceptional Event

2017-2018 PM10 Exceptional Events

2010-2012 PM2.5 and PM10 Exceptional Events

Houston Clinton Monitor Demonstrations (English Only)

2012 Exceptional Events

2011 Exceptional Events

2010 Exceptional Events

Related Topics

TCEQ Air Monitoring Network Plans

Historical air-monitoring network plans and EPA responses.

Under the requirements of 40 Code of Federal Regulations Part 58, TCEQ reviews its air monitoring network each year and creates a monitoring network plan to demonstrate how Texas is meeting or will meet federal air monitoring requirements. The monitoring plan includes proposed changes from the previous year and future proposed changes to the monitoring network. In addition, TCEQ conducts a broader analysis of the monitoring needs in Texas every five years since 2010. This five-year assessment evaluates any changes in population, emissions sources, and monitored concentrations to determine whether individual monitors within the network should be added, moved, or decommissioned to best understand and evaluate air quality.

Both the annual monitoring network plan and the five-year assessment discuss the specific air monitors that are used to meet federal air quality standards as well as other monitors that derive additional information on air quality and the weather. Because the plan and assessment are focused on federally required monitoring, they do not include a review of state-initiated monitoring that is conducted in addition to federal requirements. In the case of lead, TCEQ may also request a waiver of monitoring requirements through the plan and a renewal of any granted waivers in the assessment.

TCEQ posts the annual monitoring network plan and five-year assessments for 30 days to solicit public comment prior to their submittal to the EPA. The monitoring network plan and any comments received are sent to the EPA by July 1 of each year for review and approval. Annual monitoring network plans and the latest five-year network assessment, including TCEQ responses to public comments and the EPA response, are available below in PDF format.

IMPORTANT: Many of the AMNP files are in portfolios. These files will automatically download when clicked. You will be able to view in Adobe Reader. Get Adobe Reader

Last Five Years Monitoring Network Plans EPA Responses

2023 Annual Monitoring Network Plan

2023 Plan Anual de la Red de Monitoreo

EPA Response to the 2023 AMNP

2022 Annual Monitoring Network Plan
When you click this link, this portfolio will automatically download so you can view it with Adobe Reader or Adobe Acrobat.

EPA Response to the 2022 AMNP

2021 Annual Monitoring Network Plan
When you click this link, this portfolio will automatically download so you can view it with Adobe Reader or Adobe Acrobat.

EPA Response to the 2021 AMNP

2020 Annual Monitoring Network Plan
When you click this link, this portfolio will automatically download so you can view it with Adobe Reader or Adobe Acrobat.
EPA Response to the 2020 AMNP
2019 Annual Monitoring Network Plan EPA Response to the 2019 AMNP

Today's Texas Air Quality Forecast

The latest forecast for air quality conditions in Texas' metropolitan areas.

Envelope icon for e-mail sign up Sign up for email updates

April 18, 2024

Forecast is for Ozone, PM2.5, & PM10, and is based on EPA's Air Quality Index (AQI)

Forecast Region
(Click name for AIRNOW version)
Thu
04/18/2024
Fri
04/19/2024
Sat
04/20/2024
Sun
04/21/2024
Amarillo Good Good Good Good
Austin PM2.5 PM2.5 PM2.5 Good
Beaumont-Port Arthur PM2.5 PM2.5 Good Good
Big Bend Ozone Ozone Good Good
Brownsville-McAllen PM2.5 PM2.5 PM2.5 PM2.5
Bryan-College Station PM2.5 PM2.5 Good Good
Corpus Christi PM2.5 PM2.5 PM2.5 PM2.5
Dallas-Fort Worth PM2.5 Good Good Good
El Paso Ozone/PM2.5/PM10 Ozone/PM2.5/PM10 Ozone/PM2.5/PM10 PM2.5
Houston PM2.5 PM2.5 PM2.5 PM2.5
Laredo PM2.5 PM2.5 PM2.5 PM2.5
Lubbock Ozone Good Good Good
Midland-Odessa Ozone Good Good Good
San Antonio PM2.5 PM2.5 PM2.5 PM2.5
Tyler-Longview PM2.5 Good Good Good
Victoria PM2.5 PM2.5 PM2.5 PM2.5
Waco-Killeen PM2.5 Good Good Good
An asterisk (*) indicates that an Ozone Action Day is or will be in effect for the indicated region.
A caret (^) indicates that levels of PM may exceed the applicable short-term NAAQS. For more information see the following TCEQ websites:Air Pollution from Particulate Matter and Voluntary Tips for Citizens and Business to Reduce Emissions.

Forecast Discussion

Light winds, warm temperatures, sufficient afternoon sunshine, and/or elevated incoming background levels could be enough for ozone to reach the upper end of the "Moderate" range or possibly higher in parts of the El Paso and Midland-Odessa areas; the lower end of the "Moderate" range in parts of the Big Bend and Lubbock areas; and the upper end of the "Good" range in parts of the Amarillo, Dallas-Fort Worth, and Houston areas.

Fine urban particulate levels owing to limited dispersion from light winds could increase the daily PM2.5 AQI to the middle of the "Moderate" range in parts of the El Paso area. The daily PM10 AQI may reach the lower end of the "Moderate" range in parts of the El Paso area as well. Meanwhile, a cold front will push through the Texas Panhandle from the north today. Gusty conditions associated with this frontal boundary may generate patchy blowing dust through portions of the Texas Panhandle and South Plains. Additionally, light density residual smoke associated with seasonal fires across the Central U.S. was observed over portions of the North Central Texas and the Texas Panhandle, however the intensity and duration of any possible suspended dust and the residual smoke are not expected to be enough to raise the overall daily PM2.5 AQI beyond the "Good" range throughout the majority of the regions, which includes the Amarillo and Lubbock areas.

Southerly winds are continuing to transport elevated relative humidity levels out of the Gulf as well as moderate to high density residual smoke from ongoing seasonal burning activities throughout central-southern Mexico, Central America, as well as the Yucatan Peninsula over most of the state with the exception of Far West Texas and the Texas Panhandle. The aforementioned light density residual smoke from seasonal fires across the Central U.S. may contribute fine particulate matter over portions of North Central Texas. Overall, the density and coverage of the residual smoke plumes may be enough to raise the overall daily PM2.5 AQI to the upper end of the "Moderate" range in parts of the Brownsville-McAllen area; to the middle of the "Moderate" range in parts of the Austin, Corpus Christi, Houston, Laredo, San Antonio, and Victoria areas; to the lower to middle of the "Moderate" range in parts of the Beaumont-Port Arthur, Bryan-College Station, Dallas-Fort Worth, Tyler-Longview, and Waco-Killeen areas; and to the upper end of the "Good" range in parts of the Big Bend and Midland-Odessa areas. The daily PM10 AQI may also reach the upper end of the "Good" range in parts of the Austin, Brownsville-McAllen, Corpus Christi, Houston, and San Antonio areas as well.

Light winds, warm temperatures, sufficient afternoon sunshine, and/or elevated incoming background levels could be enough for ozone to reach the middle to upper end of the "Moderate" range in parts of the El Paso area; the lower end of the "Moderate" range in parts of the Big Bend area; and the upper end of the "Good" range in parts of the Midland-Odessa area.

Light morning winds may limit atmospheric mixing and dispersion of urban fine particulate matter long enough at the surface in portions of Far West Texas to raise the overall daily PM2.5/PM10 AQIs to the lower end of the "Moderate" range in parts of the El Paso area.

Model guidance continues to indicate that southerly winds will continue to transport elevated relative humidity levels out of the Gulf as well as moderate to high density residual smoke from seasonal burning activities throughout central-southern Mexico, Central America, as well as the Yucatan Peninsula over the majority of Texas with the exception of the Texas Panhandle and Far West Texas. Lighter density residual smoke from seasonal fires across the Central U.S. may continue to contribute slightly elevated fine particulate matter over portions of North Central Texas, Northeast Texas, and the eastern portion of the Texas Panhandle. The overall daily PM2.5 AQI may reach the lower end of the "Unhealthy for Sensitive Groups" range in parts of the Brownsville-McAllen area; the middle to upper end of the "Moderate" range in parts of the Corpus Christi, Laredo, and Victoria areas; the lower to middle of the "Moderate" range in parts of the Austin, Houston, and San Antonio areas; the lower end of the "Moderate" range in parts of the Beaumont-Port Arthur and Bryan-College Station areas; and the upper end of the "Good" range for the majority of the Amarillo, Big Bend, Dallas-Fort Worth, Midland-Odessa, Tyler-Longview, and Waco-Killeen areas. The daily PM10 AQI may also reach the lower end of the "Moderate" range in parts of the Brownsville-McAllen area and the upper end of the "Good" range in parts of the Austin, Corpus Christi, Houston, and San Antonio areas as well.

Light winds, warm temperatures, sufficient afternoon sunshine, and/or elevated incoming background levels could be enough for ozone to reach the lower to middle of the "Moderate" range in parts of the El Paso area and the upper end of the "Good" range in parts of the Big Bend and Midland-Odessa areas.

Slightly elevated urban fine particulate levels associated with light morning winds over portions of Far West Texas could be enough to raise the daily PM2.5 AQI to the lower to middle of the "Moderate" range in parts of the El Paso area. The daily PM10 AQI may reach the lower end of the "Good" range in parts of the El Paso area as well.

Newer model guidance suggests that moderate to heavy residual smoke from seasonal burning activities throughout central-southern Mexico, Central America, as well as the Yucatan Peninsula may continue to filter and linger at varying intensities across the majority of the state with the exception of Far West Texas and the Upper Texas Panhandle. Southerly winds will continue advecting elevated relative humidity levels across the southern half of the state, ahead of the aforementioned cold front, however scattered rain showers may help wash-out some of the fine particulate matter as well. Meanwhile, depending on the amount of seasonal fires across the Central U.S., light density residual smoke may continue to contribute slightly elevated fine particulate matter over portions of North Central Texas, Northeast Texas, and the Texas Panhandle. The overall daily PM2.5 AQI is forecast to reach the upper end of the "Moderate" range in parts of the Brownsville-McAllen area; the lower to middle of the "Moderate" range in parts of the Austin, Corpus Christi, Houston, Laredo, San Antonio, and Victoria areas; and the upper end of the "Good" range for the majority of the Amarillo, Beaumont-Port Arthur, Big Bend, Bryan-College Station, Dallas-Fort Worth, Midland-Odessa, Tyler-Longview, and Waco-Killeen areas.

Light winds, warm temperatures, sufficient afternoon sunshine, and/or elevated incoming background levels could be enough for ozone to reach the upper end of the "Good" range in parts of the Big Bend and El Paso areas.

Fine urban particulate levels owing to limited dispersion from light morning winds over portions of Far West Texas may be enough to increase the daily PM2.5 AQI to the lower end of the "Moderate" range in parts of the El Paso area.

Northerly windflow is expected to develop and help to begin pushing the moderate to heavy residual smoke from seasonal burning activities throughout central-southern Mexico, Central America, as well as the Yucatan Peninsula out of the state. The heavier density residual smoke may still linger over Deep South Texas, the coastal bend of Texas, and portions of Southeast Texas with lighter amounts over South Central Texas and the Permian Basin. Slightly elevated relative humidity levels may continue to contribute towards elevating PM2.5 levels over South Texas, the coastal bend of Texas, and portions of Southeast Texas. The overall daily PM2.5 AQI is forecast to reach the middle to upper end of the "Moderate" range in parts of the Brownsville-McAllen area; the lower to middle of the "Moderate" range in parts of the Corpus Christi, Laredo, and Victoria areas; the lower end of the "Moderate" range in parts of the Houston and San Antonio areas; and the upper end of the "Good" range for the majority of the Austin, Big Bend, Beaumont-Port Arthur, and Bryan-College Station areas.

Otherwise and elsewhere, moderate winds, cool to mild temperatures, and/or lower incoming background levels should help keep air quality in the "Good" range in most spots.

This forecast was last updated at 10:25 AM on Thursday, April 18th and is updated daily on normal TCEQ workdays and may also be updated on weekends or holidays when air pollution levels are high. Regardless of our forecast, we always recommend that each individual determine what level of activity they should conduct based on the actual local conditions. See the "Related Current Data" links below to monitor the latest actual conditions.

Envelope icon for e-mail sign up Sign up for email updates

Related Items

Site AutoCAD Drawings

A collection of CAD drawings to show equipment on the site.

Timeline for Near Real-time Ambient Air Quality Data Flows

Flows for continuous and automated gas chromatograph (AutoGC) data, depicting and describing the time it takes for near real-time ambient air quality data to be collected, retrieved, processed, and posted to the website.

Near Real-time Data Flow for Continuous Gaseous and Particulate Data

Timeline for near real-time continuous gaseous and particulate data from sampling to posting.  Text below provides a full description.

The figure above shows the total timeline of 60 minutes for TCEQ and partners to monitor continuous, near real-time ambient air quality and upload the data to our webpages. The timeline for each step is as follows:

  • Sample collection - 15 minutes
  • Our system calls site to pick up data - every 20 minutes
  • Data processing - 10 minutes
  • Data posted to TCEQ website - 15 minutes

Near Real-time Data Flow for AutoGC Data

Timeline for near real-time volatile organic compound by AutoGC data. Text below provides a full description.

TCEQ and our partners measure ambient air quality for volatile organic compounds using AutoGCs. The figure above shows the total timeline of 150-178 minutes to collect, analyze, and upload that data to our webpages. The timeline for each step is as follows:

  • Sample collection - 40 minutes
  • Sample Analysis - 48 minutes
  • Our system calls site to pick up data - every 60 minutes
  • Data posted to TCEQ website - 30 minutes

Historical Ozone Action Days

TCEQ maintains records of Ozone Action Days (OAD) that were forecast and the dates for which we issued an OAD alert for each metropolitan area going back to 2008.

Each day during ozone season—roughly March through November in Texas—Ozone Action Day forecasts are made for nine participating metropolitan areas. TCEQ informs the public when conditions are forecast to be favorable for high ozone levels in any of these areas. Also see Air Quality Forecast and Ozone Action Day Alerts and our video on TCEQ Ozone Action Day Forecasting.

Total number of days that were forecast to be ozone action days per metropolitan area, per year.
Year Austin Beaumont-
Port Arthur
Corpus Christi Dallas-Fort Worth El Paso Houston San Antonio Tyler-Longview Victoria
2023 13 12 2 58 13 51 13 4 0
2022 25 11 0 61 29 55 19 14 0
2021 5 4 1 28 18 26 12 3 1
2020 2 5 0 28 26 25 8 0 0
2019 5 5 0 35 35 42 7 2 0
2018 8 10 0 23 30 33 10 1 0
2017 3 4 1 21 6 27 6 0 0
2016 2 2 0 15 3 28 2 0 0
2015 1 6 0 14 1 34 2 1 0
2014 1 0 0 7 0 15 3 0 0
2013 5 4 2 24 3 25 11 2 0
2012 5 5 0 22 0 35 5 3 0
2011 9 14 5 32 3 44 9 11 5
2010 5 4 5 27 6 42 5 1 5
2009 7 5 0 36 2 38 8 6 0
2008 6 3 3 31 4 49 10 4 1

Select the appropriate tab below to see the dates we issued an OAD notification for the following metropolitan areas.

OAD dates for the Austin Metropolitan Area

2023

05/18/23
06/07/23
06/08/23
08/15/23
08/17/23
08/31/23
09/01/23
09/02/23
09/03/23
09/18/23
09/19/23
09/28/23
10/21/23

2022

03/19/22
03/25/22
04/03/22
05/26/22
05/27/22
05/28/22
07/10/22
07/13/22
08/12/22
09/09/22
09/10/22
09/14/22
09/15/22
09/22/22
09/23/22
09/27/22
09/28/22
09/29/22
09/30/22
10/01/22
10/02/22
10/03/22
10/04/22
10/06/22

2021

06/16/21
06/18/21
06/19/21
09/25/21

2020

08/20/20
09/30/20

2019

04/09/19
06/08/19
07/25/19
07/26/19

2018

04/28/18
05/07/18
05/28/18
07/26/18
07/27/18
08/01/18
08/02/18

2017

05/06/17
09/13/17
10/01/17

2016

04/23/16
05/06/16

2015

08/27/15

2014

08/14/14

2013

07/03/13
07/04/13
08/19/13
08/30/13
09/25/13

2012

06/09/12
06/24/12
09/20/12
09/21/12

2011

08/27/11
08/28/11
08/29/11
09/07/11
09/08/11
09/09/11
09/10/11
09/11/11

2010

05/28/10
05/29/10
08/28/10
08/27/10

2009

05/30/09
06/05/09
06/25/09
06/26/09
09/01/09
09/02/09

2008

05/18/08
08/14/08
08/26/08
08/31/08
09/06/08

OAD dates for the Beaumont-Port Arthur Metropolitan Area

2023

05/03/23
05/18/23
05/19/23
05/23/23
05/27/23
05/28/23
05/31/23
06/02/23
06/03/23
06/09/23
09/01/23
10/21/23

2022

05/12/22
05/27/22
05/28/22
06/18/22
06/19/22
06/20/22
06/23/22
09/15/22
09/22/22
09/23/22
10/07/22

2021

06/16/21
06/17/21
06/19/21
09/09/21

2020

06/11/20
08/17/20
08/18/20
09/30/20
10/01/20

2019

03/22/19
04/20/19
08/15/19
08/31/19
09/14/19

2018

04/28/18
05/07/18
05/15/18
05/16/18
07/26/18
07/27/18
07/28/18
08/02/18
08/03/18
08/23/18

2017

04/24/17
05/06/17
06/09/17
10/01/17

2016

06/30/16
07/01/16

2015

06/04/15
06/05/15
06/06/15
08/02/15
08/13/15
08/14/15

2014

No Issuances

2013

07/04/13
08/29/13
08/30/13
09/26/13

2012

05/22/12
06/01/12
06/27/12
09/22/12
09/23/12

2011

06/02/11
06/05/11
06/06/11
08/25/11
08/26/11
08/27/11
08/28/11
08/29/11
09/09/11
09/10/11
09/11/11
09/12/11
09/16/11
09/24/11

2010

05/27/10
05/28/10
05/29/10
10/09/10

2009

05/30/09
06/24/09
06/25/09
06/28/09
07/01/09

2008

08/26/08
08/27/08
08/30/08

OAD dates for the Corpus Christi Metropolitan Area

2023

08/30/23
08/31/23

2022

No Issuances

2021

06/18/21

2020

No Issuances

2019

No Issuances

2018

No Issuances

2017

09/12/17

2016

No Issuances

2015

No Issuances

2014

No Issuances

2013

08/18/13
09/25/13

2012

No Issuances

2011

09/07/11
09/08/11
09/09/11
09/10/11
09/11/11

2010

08/26/10
08/27/10
09/30/10
10/01/10
10/02/10

2009

No Issuances

2008

09/06/08
09/28/08
09/29/08

OAD dates for the Dallas-Fort Worth Metropolitan Area

2023

05/03/23
05/17/23
05/18/23
05/22/23
05/26/23
05/27/23
05/28/23
05/30/23
05/31/23
06/01/23
06/02/23
06/03/23
06/05/23
06/06/23
06/07/23
06/08/23
06/09/23
06/16/23
06/19/23
07/17/23
07/23/23
07/24/23
07/25/23
07/29/23
07/30/23
07/31/23
08/01/23
08/02/23
08/03/23
08/07/23
08/16/23
08/17/23
08/18/23
08/19/23
08/21/23
08/22/23
08/23/23
08/24/23
08/25/23
08/26/23
08/27/23
08/29/23
08/30/23
08/31/23
09/01/23
09/02/23
09/03/23
09/06/23
09/07/23
09/08/23
09/16/23
09/18/23
09/26/23
09/27/23
09/28/23
09/29/23
09/30/23
10/01/23

2022

03/26/22
03/27/22
04/03/22
04/30/22
05/06/22
05/07/22
05/12/22
05/14/22
05/16/22
05/27/22
05/28/22
06/11/22
06/17/22
06/18/22
06/19/22
06/20/22
06/21/22
06/22/22
06/23/22
06/24/22
06/25/22
06/29/22
06/30/22
07/01/22
07/02/22
07/09/22
07/10/22
07/11/22
07/12/22
07/13/22
07/14/22
07/15/22
07/16/22
08/11/22
08/12/22
08/13/22
08/14/22
08/16/22
08/19/22
08/26/22
09/05/22
09/07/22
09/08/22
09/09/22
09/10/22
09/14/22
09/15/22
09/16/22
09/21/22
09/22/22
09/23/22
09/24/22
09/26/22
09/27/22
09/28/22
09/29/22
10/01/22
10/02/22
10/03/22
10/05/22
10/06/22

2021

06/14/21
06/15/21
06/16/21
06/17/21
06/18/21
06/19/21
07/05/21
07/07/21
07/21/21
07/22/21
07/26/21
07/27/21
07/28/21
07/29/21
07/30/21
08/03/21
08/04/21
08/05/21
08/25/21
08/26/21
09/01/21
09/07/21
09/08/21
09/23/21
09/24/21
09/25/21
09/26/21
10/07/21

2020

05/19/20
06/04/20
06/06/20
06/07/20
06/11/20
06/12/20
06/13/20
06/14/20
06/15/20
06/25/20
08/02/20
08/04/20
08/06/20
08/15/20
08/16/20
08/17/20
08/18/20
08/19/20
08/20/20
08/21/20
08/22/20
08/23/20
08/24/20
08/25/20
09/30/20
10/06/20
10/07/20
10/11/20

2019

04/09/19
04/10/19
05/14/19
05/15/19
05/31/19
06/01/19
06/02/19
06/03/19
06/08/19
06/12/19
07/12/19
07/24/19
07/25/19
07/26/19
07/27/19
07/31/19
08/01/19
08/05/19
08/06/19
08/07/19
08/13/19
08/15/19
08/16/19
08/17/19
08/30/19
08/31/19
09/02/19
09/03/19
09/04/19
09/05/19
09/06/19
09/07/19
09/14/19
09/15/19
09/16/19

2018

04/28/18
05/06/18
05/07/18
05/08/18
05/17/18
05/24/18
05/28/18
05/29/18
06/03/18
07/20/18
07/21/18
07/22/18
07/24/18
07/25/18
07/26/18
07/27/18
07/28/18
08/01/18
08/02/18
08/03/18
08/21/18
08/22/18
08/23/18

2017

05/06/17
05/13/17
05/14/17
05/15/17
05/30/17
05/31/17
06/08/17
06/20/17
07/07/17
07/31/17
08/03/17
08/04/17
08/05/17
08/09/17
08/10/17
08/22/17
09/01/17
09/13/17
09/14/17
10/01/17
10/02/17

2016

04/23/16
05/06/16
06/07/16
06/08/16
06/09/16
06/18/16
06/20/16
06/29/16
06/30/16
07/01/16
07/26/16
07/27/16
08/31/16
09/21/16
09/22/16

2015

05/01/15
06/05/15
06/06/15
06/09/15
07/30/15
08/01/15
08/03/15
08/10/15
08/13/15
08/14/15
08/26/15
08/27/15
08/28/15
09/24/15

2014

07/19/14
07/22/14
07/23/14
07/24/14
07/25/14
08/13/14
08/14/14

2013

06/03/13
07/04/13
07/05/13
07/12/13
07/13/13
07/18/13
07/25/13
08/01/13
08/10/13
08/11/13
08/16/13
08/18/13
08/19/13
08/20/13
08/29/13
08/30/13
08/31/13
09/03/13
09/04/13
09/05/13
09/06/13
09/12/13
09/25/13
09/26/13

2012

05/16/12
05/17/12
05/18/12
05/22/12
06/09/12
06/22/12
06/23/12
06/24/12
06/25/12
06/26/12
06/27/12
06/28/12
08/07/12
08/08/12
08/09/12
08/11/12
08/14/12
08/20/12
09/10/12
09/21/12
09/22/12
09/23/12

2011

06/05/11
06/06/11
06/23/11
07/01/11
07/02/11
07/06/11
07/07/11
07/08/11
07/18/11
07/19/11
07/27/11
08/02/11
08/03/11
08/04/11
08/14/11
08/15/11
08/22/11
08/25/11
08/26/11
08/27/11
08/28/11
08/29/11
08/30/11
09/01/11
09/10/11
09/11/11
09/12/11
09/21/11
09/27/11
09/28/11
09/29/11
10/04/11

2010

05/26/10
05/27/10
05/28/10
05/29/10
05/30/10
06/04/10
06/24/10
07/17/10
08/02/10
08/03/10
08/05/10
08/06/10
08/11/10
08/12/10
08/13/10
08/17/10
08/18/10
08/23/10
08/24/10
08/26/10
08/27/10
08/28/10
09/05/10
09/16/10
09/17/10
09/18/10
09/19/10

2009

05/21/09
05/29/09
05/30/09
05/31/09
06/05/09
06/06/09
06/24/09
06/25/09
06/26/09
06/27/09
06/28/09
07/01/09
07/02/09
07/03/09
07/07/09
07/08/09
07/17/09
07/19/09
07/22/09
07/23/09
07/24/09
08/12/09
08/13/09
08/14/09
08/22/09
08/23/09
08/24/09
08/25/09
08/26/09
09/01/09
09/02/09
09/05/09
09/06/09
09/07/09
09/08/09
09/09/09

2008

05/18/08
05/29/08
06/22/08
06/30/08
07/01/08
07/16/08
07/17/08
07/18/08
07/20/08
08/03/08
08/04/08
08/13/08
08/14/08
08/23/08
08/24/08
08/26/08
08/27/08
08/28/08
08/29/08
08/30/08
08/31/08
09/05/08
09/06/08
09/07/08
09/20/08
09/21/08
09/25/08
09/26/08
09/27/08
09/28/08
09/29/08

OAD dates for the El Paso Metropolitan Area

2023

05/12/23
06/28/23
07/05/23
07/16/23
08/03/23
08/04/23
08/05/23
08/06/23
08/30/23
08/31/23
09/01/23
09/02/23
09/03/23

2022

04/30/22
05/14/22
05/15/22
05/26/22
05/27/22
06/01/22
06/08/22
06/10/22
06/11/22
06/30/22
07/01/22
07/02/22
07/05/22
07/06/22
07/10/22
07/11/22
07/12/22
07/15/22
07/16/22
07/21/22
07/23/22
07/26/22
08/02/22
08/05/22
08/13/22
08/14/22
08/26/22
09/09/22
09/10/22

2021

05/05/21
06/12/21
06/18/21
06/19/21
06/22/21
06/23/21
07/09/21
07/10/21
07/17/21
07/21/21
07/22/21
07/26/21
08/04/21
08/06/21
08/07/21
08/08/21
09/14/21
09/15/21

2020

06/02/20
06/03/20
06/04/20
06/25/20
07/10/20
07/17/20
07/18/20
07/21/20
07/28/20
08/02/20
08/03/20
08/04/20
08/05/20
08/07/20
08/10/20
08/11/20
08/12/20
08/13/20
08/14/20
08/19/20
08/20/20
08/21/20
08/22/20
08/27/20
08/28/20
08/29/20

2019

4/19/2019
05/14/19
05/15/19
05/24/19
05/30/19
05/31/19
06/02/19
06/06/19
06/07/19
06/11/19
07/12/19
07/14/19
07/15/19
07/16/19
07/20/19
07/21/19
07/24/19
07/25/19
07/26/19
07/27/19
07/31/19
08/01/19
08/02/19
08/06/19
08/15/19
08/23/19
08/24/19
08/26/19
08/27/19
08/28/19
08/29/19
08/30/19
08/31/19
09/02/19
09/06/19

2018

04/26/18
05/07/18
05/09/18
05/24/18
06/07/18
06/08/18
06/21/18
06/23/18
06/25/18
06/26/18
06/27/18
06/28/18
07/20/18
07/21/18
07/22/18
07/23/18
07/25/18
07/29/18
07/30/18
08/01/18
08/02/18
08/03/18
08/04/18
08/14/18
08/29/18
09/09/18
09/10/18
09/11/18
09/12/18
09/24/18

2017

06/09/17
06/14/17
06/17/17
06/20/17
06/21/17
09/12/17

2016

06/08/16
06/18/16
07/04/16

2015

07/01/15

2014

No Issuances

2013

06/11/13
06/12/13
06/27/13

2012

No Issuances

2011

06/22/11
06/26/11
08/05/11

2010

07/13/10
07/14/10
07/15/10
08/04/10
08/10/10
08/13/10

2009

07/24/09
07/25/09

2008

06/14/08
07/31/08
08/12/08
08/13/08

OAD dates for the Houston Metropolitan Area

2023

03/25/23
04/01/23
04/30/23
05/03/23
05/17/23
05/18/23
05/19/23
05/20/23
05/22/23
05/23/23
05/24/23
05/25/23
05/26/23
05/27/23
05/28/23
05/31/23
06/01/23
06/02/23
06/03/23
06/04/23
06/05/23
06/06/23
06/07/23
06/08/23
06/09/23
07/31/23
08/02/23
08/15/23
08/16/23
08/17/23
08/24/23
08/25/23
08/26/23
08/27/23
08/29/23
08/30/23
08/31/23
09/01/23
09/02/23
09/03/23
09/07/23
09/08/23
09/11/23
09/12/23
09/17/23
09/18/23
09/19/23
09/27/23
09/28/23
10/20/23
10/21/23

2022

03/10/22
03/19/22
03/25/22
03/26/22
04/03/22
04/28/22
05/06/22
05/11/22
05/12/22
05/13/22
05/14/22
05/16/22
05/26/22
05/27/22
05/28/22
06/02/22
06/03/22
06/04/22
06/09/22
06/17/22
06/18/22
06/19/22
06/20/22
06/22/22
06/23/22
06/24/22
06/25/22
06/26/22
07/13/22
08/16/22
08/18/22
08/26/22
09/01/22
09/07/22
09/09/22
09/10/22
09/11/22
09/13/22
09/14/22
09/15/22
09/16/22
09/20/22
09/21/22
09/22/22
09/23/22
09/24/22
09/25/22
09/26/22
10/01/22
10/02/22
10/03/22
10/04/22
10/05/22
10/06/22
10/07/22

2021

04/20/21
04/25/21
05/06/21
06/13/21
06/14/21
06/15/21
06/16/21
06/17/21
06/18/21
06/19/21
07/21/21
07/22/21
07/26/21
07/27/21
07/28/21
08/04/21
08/25/21
09/07/21
09/08/21
09/09/21
09/25/21
09/26/21
10/06/21
10/07/21
10/08/21
10/09/21

2020

04/24/20
05/01/20
05/11/20
05/18/20
05/19/20
05/27/20
06/11/20
06/12/20
06/13/20
06/16/20
06/17/20
08/03/20
08/04/20
08/07/20
08/17/20
08/18/20
08/19/20
08/20/20
08/21/20
08/22/20
09/06/20
09/30/20
10/01/20
10/07/20
10/14/20

2019

03/22/19
04/02/19
04/09/19
04/10/19
04/11/19
04/15/19
04/20/19
04/21/19
04/26/19
04/27/19
04/28/19
05/05/19
05/13/19
05/14/19
06/01/19
06/03/19
06/08/19
06/09/19
06/12/19
06/13/19
06/14/19
06/28/19
06/29/19
07/24/19
07/25/19
07/26/19
07/27/19
08/15/19
08/16/19
08/31/19
09/01/19
09/02/19
09/03/19
09/04/19
09/05/19
09/06/19
09/07/19
09/08/19
09/14/19
10/04/19
10/05/19
10/09/19

2018

04/16/18
04/24/18
04/25/18
04/27/18
04/28/18
04/29/18
05/06/18
05/07/18
05/08/18
05/09/18
05/15/18
05/16/18
05/17/18
05/28/18
05/29/18
06/03/18
06/07/18
07/20/18
07/21/18
07/25/18
07/26/18
07/27/18
07/28/18
07/29/18
07/30/18
08/01/18
08/02/18
08/03/18
08/23/18
08/24/18
08/26/18
09/18/18
09/19/18

2017

03/31/17
04/06/17
04/07/17
04/24/17
05/01/17
05/06/17
05/07/17
05/13/17
05/14/17
05/15/17
05/24/17
06/08/17
06/09/17
06/10/17
07/31/17
08/01/17
08/31/17
09/01/17
09/02/17
09/03/17
09/05/17
09/12/17
09/13/17
09/14/17
10/01/17
10/13/17
10/18/17

2016

03/26/16
04/03/16
04/04/16
04/05/16
04/07/16
04/22/16
04/23/16
05/04/16
05/05/16
05/06/16
05/07/16
05/13/16
05/14/16
06/06/16
06/07/16
06/08/16
06/09/16
06/18/16
06/27/16
06/30/16
07/01/16
07/22/16
09/21/16
09/28/16
09/29/16
09/30/16
10/07/16
10/10/16

2015

04/30/15
05/01/15
05/02/15
06/02/15
06/03/15
06/04/15
06/05/15
06/06/15
06/07/15
06/08/15
07/29/15
07/30/15
07/31/15
08/01/15
08/02/15
08/03/15
08/10/15
08/11/15
08/12/15
08/13/15
08/14/15
08/15/15
08/24/15
08/25/15
08/26/15
08/27/15
08/28/15
08/29/15
09/20/15
09/21/15
09/22/15
09/23/15
10/10/15
10/15/15

2014

04/09/14
04/19/14
05/02/14
05/29/14
06/11/14
07/05/14
07/06/14
07/24/14
07/25/14
08/14/14
08/25/14
09/22/14
09/24/14
10/25/14

2013

05/06/13
05/07/13
06/03/13
06/07/13
06/08/13
06/29/13
06/30/13
07/01/13
07/02/13
07/03/13
07/04/13
07/05/13
07/13/13
08/16/13
08/17/13
08/18/13
08/19/13
08/28/13
08/29/13
08/30/13
08/31/13
09/13/13
09/25/13
09/26/13
10/24/13

2012

03/24/12
03/25/12
03/26/12
04/06/12
04/07/12
04/08/12
04/09/12
04/18/12
04/19/12
04/24/12
05/14/12
05/17/12
05/18/12
05/21/12
05/22/12
06/01/12
06/02/12
06/22/12
06/23/12
06/25/12
06/26/12
06/27/12
06/28/12
07/29/12
08/07/12
08/08/12
08/20/12
08/21/12
09/10/12
09/11/12
09/20/12
09/21/12
09/22/12
09/23/12
10/03/12

2011

04/12/11
05/05/11
05/06/11
05/17/11
05/26/11
06/02/11
06/03/11
06/05/11
06/06/11
06/07/11
07/01/11
07/05/11
07/06/11
08/01/11
08/18/11
08/19/11
08/20/11
08/21/11
08/25/11
08/26/11
08/27/11
08/28/11
08/29/11
08/30/11
08/31/11
09/06/11
09/07/11
09/08/11
09/09/11
09/10/11
09/11/11
09/12/11
09/15/11
09/16/11
09/20/11
09/21/11
09/22/11
09/23/11
09/24/11
09/30/11
10/03/11
10/04/11
10/11/11
10/16/11

2010

04/03/10
04/26/10
04/28/10
05/02/10
05/03/10
05/04/10
05/05/10
05/26/10
05/27/10
05/28/10
05/29/10
05/30/10
06/22/10
07/10/10
07/16/10
07/17/10
07/31/10
08/01/10
08/02/10
08/03/10
08/11/10
08/17/10
08/23/10
08/24/10
08/25/10
08/26/10
08/27/10
08/28/10
09/05/10
09/14/10
09/15/10
09/16/10
09/29/10
09/30/10
10/01/10
10/02/10
10/06/10
10/07/10
10/08/10
10/09/10
10/15/10
10/16/10

2009

03/17/09
03/19/09
04/03/09
04/14/09
04/21/09
05/04/09
05/20/09
05/21/09
05/28/09
05/29/09
05/30/09
05/31/09
06/04/09
06/05/09
06/06/09
06/23/09
06/24/09
06/25/09
06/26/09
06/27/09
06/28/09
06/29/09
06/30/09
07/01/09
07/02/09
08/13/09
08/14/09
08/22/09
08/23/09
08/29/09
08/30/09
08/31/09
09/01/09
09/02/09
09/03/09
09/06/09
09/07/09
09/27/09

2008

04/19/08
04/29/08
05/17/08
05/18/08
05/28/08
05/29/08
06/18/08
06/19/08
06/20/08
06/21/08
06/22/08
06/23/08
07/01/08
07/02/08
07/16/08
07/17/08
07/18/08
07/19/08
07/20/08
07/21/08
08/03/08
08/04/08
08/13/08
08/14/08
08/23/08
08/24/08
08/25/08
08/26/08
08/27/08
08/28/08
08/29/08
08/30/08
08/31/08
09/05/08
09/06/08
09/07/08
09/26/08
09/27/08
09/28/08
09/29/08
10/01/08
10/02/08
10/09/08
10/10/08
10/19/08
10/20/08
10/25/08
10/26/08
11/01/08

OAD dates for the San Antonio Metropolitan Area

2023

05/18/23
06/07/23
08/17/23
08/27/23
08/30/23
08/31/23
09/01/23
09/02/23
09/03/23
09/12/23
09/18/23
09/19/23
09/28/23

2022

03/25/22
05/06/22
05/26/22
05/27/22
09/09/22
09/10/22
09/13/22
09/14/22
09/15/22
09/28/22
09/29/22
09/30/22
10/01/22
10/02/22
10/03/22
10/04/22
10/05/22
10/06/22
10/07/22

2021

04/25/21
05/03/21
05/06/21
06/16/21
06/18/21
06/19/21
09/23/21
09/24/21
09/25/21
09/26/21
10/06/21
10/07/21

2020

04/24/20
05/01/20
05/18/20
06/08/20
08/03/20
08/20/20
09/30/20
10/06/20

2019

04/09/19
04/26/19
06/08/19
07/24/19
07/25/19
07/26/19
07/27/19

2018

04/28/18
05/06/18
05/07/18
05/17/18
05/28/18
07/26/18
07/27/18
08/01/18
08/02/18
08/03/18

2017

05/06/17
08/09/17
09/12/17
09/13/17
10/01/17
10/02/17

2016

04/23/16
05/06/16

2015

08/02/15
08/27/15

2014

05/29/14
05/30/14
08/14/14

2013

06/03/13
06/29/13
06/30/13
07/03/13
07/04/13
08/16/13
08/17/13
08/18/13
08/19/13
08/30/13
09/25/13

2012

06/09/12
06/24/12
09/20/12
09/21/12
09/22/12

2011

08/27/11
08/28/11
08/29/11
09/07/11
09/08/11
09/09/11
09/10/11
09/11/11
09/12/11

2010

05/28/10
05/29/10
08/27/10
08/28/10
09/05/10

2009

05/29/09
05/30/09
06/05/09
06/25/09
06/26/09
09/01/09
09/02/09
09/07/09

2008

05/18/08
08/14/08
08/26/08
08/31/08
09/06/08
09/20/08
09/26/08
09/27/08
09/28/08
09/29/08

OAD dates for the Tyler-Longview Metropolitan Area

2023

05/31/23
06/02/23
06/07/23
06/09/23

2022

03/27/22
05/07/22
05/12/22
05/28/22
06/18/22
06/19/22
06/21/22
06/23/22
07/10/22
07/11/22
07/13/22
07/14/22
08/19/22
09/16/22

2021

06/19/21
09/25/21
09/26/21

2020

No Issuances

2019

08/15/19
09/06/19

2018

08/03/18

2017

No Issuances

2016

No Issuances

2015

06/06/15

2014

No Issuances

2013

08/30/13
09/06/13

2012

06/27/12
09/22/12
09/23/12

2011

08/22/11
08/25/11
08/26/11
08/27/11
08/28/11
08/29/11
08/30/11
09/10/11
09/11/11
09/12/11
09/28/11

2010

08/27/10

2009

05/30/09
06/26/09
07/01/09
07/02/09
07/23/09
07/24/09

2008

07/17/08
08/14/08
08/27/08
08/30/08

OAD dates for the Victoria Metropolitan Area

2023

No Issuances

2022

No Issuances

2021

06/18/21

2020

No Issuances

2019

No Issuances

2018

No Issuances

2017

No Issuances

2016

No Issuances

2015

No Issuances

2014

No Issuances

2013

No Issuances

2012

No Issuances

2011

09/07/11
09/08/11
09/09/11
09/10/11
09/11/11

2010

08/26/10
08/27/10
09/30/10
10/01/10
10/02/10

2009

No Issuances

2008

09/06/08

Texas Commission on Environmental Quality Draft 2024 Annual Monitoring Network Plan

The public is invited to comment on the Texas Commission on Environmental Quality (TCEQ) draft 2024 Annual Monitoring Network Plan.

Public comment period begins today

April 17, 2024

The Texas Commission on Environmental Quality (TCEQ) is providing an opportunity for the public to comment on the TCEQ draft 2024 Annual Monitoring Network Plan.

The draft 2024 Annual Monitoring Network Plan (AMNP) provides information on the current TCEQ ambient air monitoring network to demonstrate how Texas is meeting or will meet federal monitoring requirements specified in 40 Code of Federal Regulations Part 58 and its appendices. This document presents the current Texas federal network established to determine compliance with the National Ambient Air Quality Standards and to meet federal monitoring requirements and objectives. This plan is limited to the portion of the TCEQ air monitoring network designed to comply with federal monitoring requirements and supported by federal funding. The plan and assessment are focused on federally required monitoring and do not include a review of state-initiated monitoring conducted in addition to federal requirements. The TCEQ’s robust network of state-initiative monitors supports a variety of purposes, including potential health effects evaluation. A review of these state-initiative monitors is outside the scope of this document and not included.

The TCEQ continues to evaluate additional ambient air monitoring requested during previous Annual Monitoring Network Plan public inspection and comment periods. This document includes the recommended federal monitoring network changes from July 1, 2023, through December 31, 2025.

Historical Annual Monitoring Network Plans for the last five years can be obtained from the TCEQ Air Monitoring Network Plans webpage.

PDF copies of the draft Annual Monitoring Network Plan in English and Spanish:

2024 Draft Annual Monitoring Network Plan (English version)
Proyecto de Plan Anual de la Red de Seguimiento 2024 (Spanish version)

Instructions for Comments

The draft 2024 Annual Monitoring Network Plan will have a 30-day comment period during which any person may submit written comments on the draft plan. The comment period closes at midnight on May 16, 2024. Written comment information, including name, email address and physical address, will become part of the agency’s public record. Public comments pertaining to the draft 2024 Annual Monitoring Network Plan can be mailed to the contact below:

Texas Commission on Environmental Quality
P.O. Box 13087
Attention: Holly Landuyt, MC-165
Austin, Texas 78711-3087
Or sent via email to: tceqamnp@tceq.texas.gov

The final 2024 Annual Monitoring Network Plan, including public comments received during the 30-day inspection period, TCEQ responses to the comments, and any appropriate changes based on the received comments, will be submitted to the United States Environmental Protection Agency and posted on the TCEQ webpage on July 1, 2024.